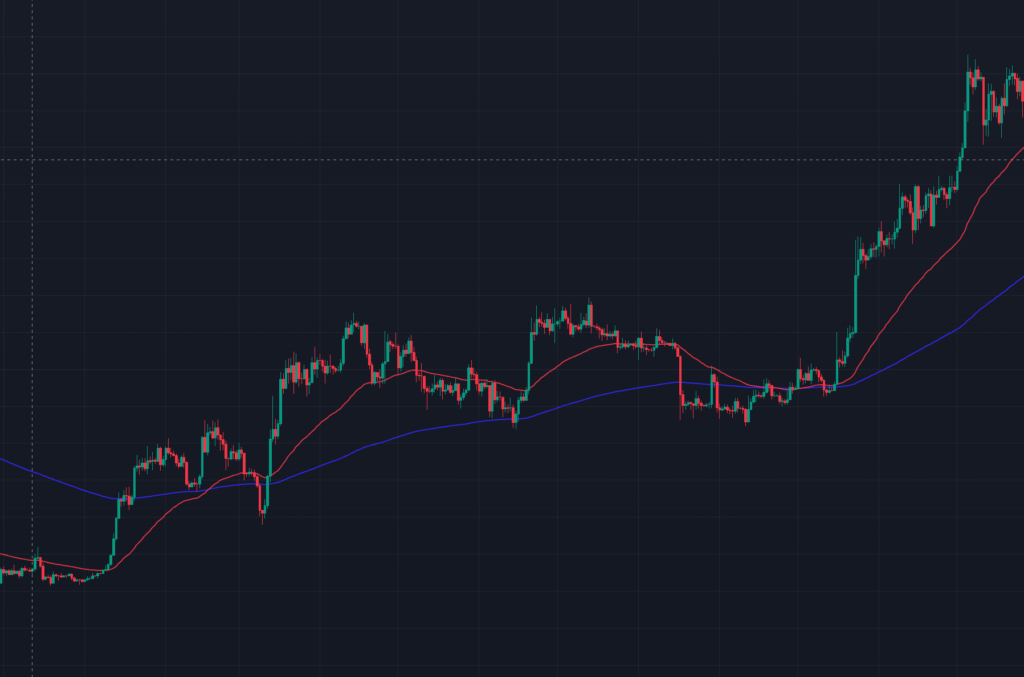
Moving averages are a popular technical analysis tool used in trading to smooth out price data and identify trends over a specific period of time. They help traders filter out short-term noise and focus on the broader direction of an asset’s price movement.
How Moving Averages Work?
A moving average (MA) calculates the average price of an asset over a set number of periods, updating as new data becomes available. The “moving” part comes from the fact that the average shifts forward with each new price point, dropping the oldest data in the calculation.
There are two main types of moving averages:
- Simple Moving Average (SMA):
- Formula: SMA = (Sum of prices over n periods) / n
- Example: A 10-day SMA adds up the closing prices of the last 10 days and divides by 10. On day 11, the oldest price (day 1) is dropped, and the newest price (day 11) is added.
- It gives equal weight to all prices in the period.
- Exponential Moving Average (EMA):
- EMA places more weight on recent prices, making it more responsive to new data.
- Formula: EMA = (Current Price × Smoothing Factor) + (Previous EMA × (1 – Smoothing Factor))
- Smoothing Factor = 2 / (n + 1), where n is the number of periods.
- Example: A 10-day EMA reacts faster to price changes than a 10-day SMA because it prioritizes the latest data.
Common time periods for MAs include 10, 20, 50, 100, and 200 days, though traders can adjust this based on their strategy (short-term vs. long-term).
How to Read Moving Averages?
- Trend Direction:
- Uptrend: If the moving average is sloping upward, it suggests the price is increasing over time.
- Downtrend: A downward slope indicates a declining price trend.
- Sideways: A flat MA suggests consolidation or no clear trend.
- Price vs. Moving Average:
- If the current price is above the MA, it’s generally a bullish signal (potential buying opportunity).
- If the price is below the MA, it’s a bearish signal (potential selling opportunity).
- Crossovers:
- Golden Cross: When a shorter-term MA (e.g., 50-day) crosses above a longer-term MA (e.g., 200-day), it’s a bullish signal suggesting a potential uptrend.
- Death Cross: When a shorter-term MA crosses below a longer-term MA, it’s a bearish signal indicating a potential downtrend.
The 200-day MA and the 50-day MA are regarded as the leading moving averages.
- Support and Resistance:
- MAs can act as dynamic support (price tends to bounce off it in an uptrend) or resistance (price struggles to break through in a downtrend).

How Moving Averages Are Used in Trading?
- Trend Identification:
- Traders use MAs to confirm the direction of a trend. For example, a stock trading above its 200-day SMA might be considered in a long-term uptrend.
- Entry and Exit Signals:
- Crossover Strategy: Buy when a short-term MA crosses above a long-term MA; sell when it crosses below.
- Price Breakouts: Enter a trade when the price breaks above a key MA with strong volume, or exit when it falls below.
- Support/Resistance Trading:
- Traders might buy near a rising MA acting as support or sell/short near a declining MA acting as resistance.
- Filtering Noise:
- Short-term traders (e.g., using a 10-day EMA) can focus on quick price moves, while long-term investors (e.g., 200-day EMA) use MAs to avoid reacting to daily fluctuations.
- Combining with Other Indicators:
- MAs are often paired with tools like the Relative Strength Index (RSI) or MACD (Moving Average Convergence Divergence) to confirm signals and reduce false positives.
Things to Keep in Mind
- Lagging Nature: MAs are based on past data, so they lag behind real-time price action. EMAs reduce this lag more than SMAs.
- False Signals: In choppy or sideways markets, MAs can generate whipsaws (false buy/sell signals). Combining them with other indicators helps.
- Timeframe Matters: Short-term MAs (e.g., 10-day) suit day traders, while long-term MAs (e.g., 200-day) suit investors.
In short, moving averages are a versatile tool for understanding trends, spotting trade setups, and managing risk.
Happy Trading!

