
In the world of technical analysis, traders rely on a variety of indicators to make informed decisions about market trends, entry points, and exit strategies. One of the most popular and widely used tools is the Relative Strength Index (RSI), an oscillator that helps traders gauge the strength of price movements and identify potential trading opportunities. In this article, we will explore what the RSI is, how it works, how to read it, and how traders can take advantage of it to improve their trading strategies.
What is the RSI Oscillator?
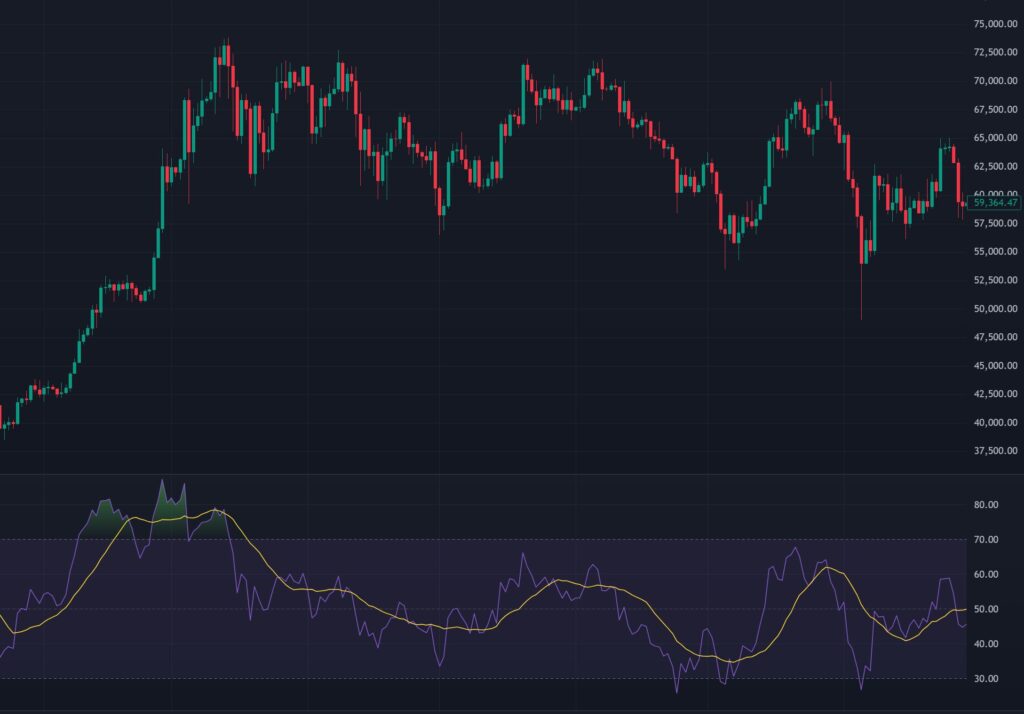
The Relative Strength Index (RSI) is a momentum oscillator developed by J. Welles Wilder Jr. in 1978. It is designed to measure the speed and magnitude of price movements in a financial instrument, such as stocks, forex, commodities, or cryptocurrencies. The RSI is primarily used to identify overbought and oversold conditions in the market, which can signal potential reversals or trend continuations.
The RSI is expressed as a value between 0 and 100, with specific thresholds used to interpret market conditions. It is typically plotted as a line graph beneath a price chart, making it easy to visualize alongside price action.
Key Features of the RSI:
- Range: 0 to 100
- Overbought threshold: Typically above 70
- Oversold threshold: Typically below 30
- Centerline: 50 (used to assess trend strength)
How Does the RSI Work?
The RSI is a momentum-based indicator, meaning it analyzes the strength of recent price movements to determine whether an asset is gaining or losing momentum. It does this by comparing the magnitude of recent gains to recent losses over a specified period, typically 14 days (though traders can adjust this setting).
The RSI Formula
The RSI is calculated using the following steps:
- Calculate the average gain and average loss over a chosen period (e.g., 14 days):
- Gains are the price increases on up days.
- Losses are the price decreases on down days (expressed as a positive number).
- Calculate the Relative Strength (RS): RS=Average Gain/Average Loss
- Calculate the RSI: RSI=100−(100/(1+RS))
The result is a value between 0 and 100, which is plotted as a line on the RSI chart.
What the RSI Measures
- If gains outweigh losses, the RSI rises, indicating bullish momentum.
- If losses outweigh gains, the RSI falls, indicating bearish momentum.
- The RSI tends to move in tandem with price trends but can also provide early warnings of potential reversals or continuations.
How to Read the RSI Oscillator?
Reading the RSI is straightforward once you understand its key levels and signals. Below is a breakdown of how to interpret the RSI and what its values mean.
1. Overbought and Oversold Conditions
The RSI is most commonly used to identify overbought and oversold conditions, which can signal potential price reversals.
- Overbought (RSI > 70): When the RSI exceeds 70, it suggests that the asset may be overbought, meaning it has risen too far, too fast, and could be due for a pullback or correction. This is often a signal for traders to consider selling or taking profits, especially in a downtrend.
- Oversold (RSI < 30): When the RSI falls below 30, it indicates that the asset may be oversold, meaning it has fallen too far, too fast, and could be due for a bounce or rally. This is often a signal for traders to consider buying, especially in an uptrend.
Important Note: Overbought and oversold signals are not guarantees of a reversal. In strong trends, the RSI can remain in overbought or oversold territory for extended periods. Always confirm signals with other indicators or price action analysis.
2. The Centerline (RSI = 50)
The 50 level on the RSI is considered the centerline and can be used to assess the overall trend of the market.
- RSI above 50: Indicates bullish momentum, suggesting the asset is in an uptrend.
- RSI below 50: Indicates bearish momentum, suggesting the asset is in a downtrend.
3. Divergences
One of the most powerful signals provided by the RSI is divergence, which occurs when the price of an asset and the RSI move in opposite directions. Divergences can signal potential trend reversals.
- Bullish Divergence: Occurs when the price makes a lower low, but the RSI makes a higher low. This suggests that bearish momentum is weakening, and a reversal to the upside may be imminent. Traders often use this as a buy signal.
- Bearish Divergence: Occurs when the price makes a higher high, but the RSI makes a lower high. This suggests that bullish momentum is weakening, and a reversal to the downside may be imminent. Traders often use this as a sell signal.
4. Trend Strength
The RSI can also help traders gauge the strength of a trend by observing how it behaves around key levels.
- In a strong uptrend, the RSI may consistently stay above 50 and frequently enter overbought territory (above 70) without significant pullbacks.
- In a strong downtrend, the RSI may consistently stay below 50 and frequently enter oversold territory (below 30) without significant rallies.
5. Failure Swings
Failure swings are specific patterns in the RSI that can signal potential reversals, even without crossing the 70 or 30 thresholds.
- Bullish Failure Swing: Occurs when the RSI dips into oversold territory (below 30), rises above 30, pulls back without falling below 30 again, and then breaks above its previous high. This is a strong buy signal.
- Bearish Failure Swing: Occurs when the RSI rises into overbought territory (above 70), falls below 70, rallies without rising above 70 again, and then breaks below its previous low. This is a strong sell signal.
How to Take Advantage of the RSI in Trading?
The RSI is a versatile tool that can be used in various trading strategies, from trend-following to reversal trading. Below are some practical ways to incorporate the RSI into your trading plan.
1. Trading Overbought and Oversold Levels
One of the simplest RSI strategies is to buy when the RSI indicates oversold conditions and sell when it indicates overbought conditions. However, to improve accuracy, consider the following:
- Confirm with the Trend: In an uptrend, oversold conditions (RSI < 30) are more likely to signal buying opportunities, while overbought conditions may not lead to immediate reversals. In a downtrend, overbought conditions (RSI > 70) are more likely to signal selling opportunities, while oversold conditions may not lead to immediate rallies.
- Use Additional Confirmation: Combine RSI signals with other indicators (e.g., moving averages, support/resistance levels) or price action patterns (e.g., candlestick patterns) to reduce false signals.
2. Trading Divergences
Divergences are powerful signals for identifying potential reversals, especially in ranging markets. To trade divergences effectively:
- Look for clear bullish or bearish divergences between price and RSI.
- Wait for confirmation, such as a break of a trendline, a moving average crossover, or a candlestick pattern, before entering a trade.
- Use stop-loss orders to manage risk, as divergences can sometimes fail in strong trends.
3. Using RSI to Confirm Trends
The RSI can be a valuable tool for confirming the strength of a trend and identifying potential trend continuations.
- In an uptrend, look for the RSI to remain above 50 and use dips toward 40–50 as potential buying opportunities.
- In a downtrend, look for the RSI to remain below 50 and use rallies toward 50–60 as potential selling opportunities.
4. Adjusting RSI Settings
The default RSI period is 14, but traders can adjust this setting to suit their trading style and timeframe.
- Shorter periods (e.g., 7): Make the RSI more sensitive, generating more signals but increasing the risk of false signals. This is suitable for short-term traders or scalpers.
- Longer periods (e.g., 21): Make the RSI less sensitive, generating fewer but potentially more reliable signals. This is suitable for swing traders or long-term investors.
5. Combining RSI with Other Indicators
To maximize the effectiveness of the RSI, consider combining it with other technical indicators or tools, such as:
- Moving Averages: Use moving averages to confirm the trend direction before acting on RSI signals.
- Support and Resistance: Look for RSI signals near key support or resistance levels to increase the likelihood of a successful trade.
- MACD: Use the Moving Average Convergence Divergence (MACD) to confirm RSI divergence signals.
- Bollinger Bands: Combine RSI overbought/oversold signals with Bollinger Band breakouts or contractions to identify high-probability setups.
6. Risk Management
No indicator is foolproof, and the RSI is no exception. To protect your capital, always incorporate sound risk management practices, such as:
- Using stop-loss orders to limit potential losses.
- Position sizing based on your risk tolerance and account size.
- Avoiding overtrading by waiting for high-probability setups.
Advantages and Limitations of the RSI
Advantages
- Ease of Use: The RSI is simple to understand and apply, making it suitable for beginners and experienced traders alike.
- Versatility: The RSI can be used in various markets (stocks, forex, crypto, etc.) and timeframes (intraday, daily, weekly, etc.).
- Early Warnings: The RSI can provide early signals of potential reversals or trend continuations, giving traders an edge.
- Divergence Detection: RSI divergences are powerful tools for spotting trend exhaustion and potential reversals.
Limitations
- False Signals: The RSI can generate false signals, especially in strong trends or choppy markets.
- Lagging Indicator: Like most momentum indicators, the RSI is based on past price data and may lag behind real-time price action.
- Overreliance: Relying solely on the RSI without confirmation from other tools or analysis can lead to poor trading decisions.
- Context Matters: Overbought and oversold signals must be interpreted in the context of the broader market trend and conditions.
Conclusion
The Relative Strength Index (RSI) is a powerful and versatile tool that can enhance your trading strategy when used correctly. By understanding how to read the RSI, interpret its signals, and combine it with other forms of analysis, traders can gain valuable insights into market momentum, trend strength, and potential reversals. However, like any technical indicator, the RSI is most effective when used as part of a comprehensive trading plan that includes proper risk management and confirmation from other tools.
Whether you’re a beginner looking to dip your toes into technical analysis or an experienced trader seeking to refine your strategy, mastering the RSI oscillator can give you a competitive edge in the markets. Start practicing with a demo account, experiment with different RSI settings, and always remember that patience and discipline are key to successful trading.
Happy Trading!