
Volume is one of the most fundamental concepts in trading, yet it’s often overlooked by beginners in favor of price movements or technical indicators. However, seasoned traders know that volume provides critical insights into market activity and can be a powerful tool for making informed trading decisions. In this article, we’ll break down what volume is, how it works, how to read it, and how it can be applied in trading strategies.
What Is Volume?
In the context of financial markets, volume refers to the total number of shares, contracts, or units of an asset traded during a specific period of time. For example:
- In stock trading, volume is the number of shares exchanged between buyers and sellers.
- In futures or options markets, it’s the number of contracts traded.
- In cryptocurrency markets, it’s the amount of a specific coin or token traded.
Volume is typically measured over a set timeframe, such as a day, an hour, or even a single minute, depending on the chart you’re analyzing. It’s a direct reflection of market activity and participant interest in an asset.
Think of volume as the “energy” behind price movements. High volume indicates strong participation and conviction, while low volume suggests apathy or indecision.
How Does Volume Work?
Volume is generated by the interaction of buyers and sellers in the market. Every trade—whether it’s a buy or a sell—contributes to the total volume. Here’s how it ties into price action:
- When a buyer purchases an asset from a seller, that transaction adds to the volume count.
- The price at which the trade occurs reflects supply and demand dynamics, but volume tells you how much of that asset changed hands.
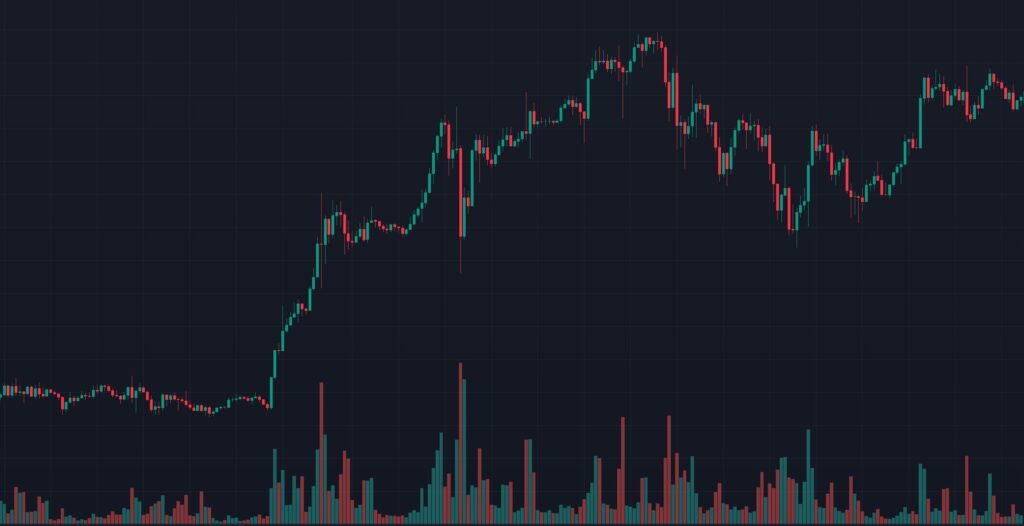
Volume is often displayed as a histogram (a series of vertical bars) beneath a price chart in trading platforms. Each bar corresponds to the volume traded during the timeframe of the candlestick or bar above it (e.g., one bar per day on a daily chart).
Key points about how volume works:
- Volume precedes price: Significant changes in volume often signal upcoming price movements.
- It’s cumulative: Volume adds up over time but resets at the start of a new period (e.g., daily volume resets each trading day).
- Context matters: Volume must be compared to historical levels to be meaningful—10,000 shares traded might be high for one stock but low for another.
How to Read Volume?
Reading volume is about understanding its relationship with price and identifying patterns. Here’s a step-by-step guide:
- Look at the Volume Bars:
- On a chart, taller bars mean higher volume; shorter bars mean lower volume.
- Compare the current volume to the average volume (often shown as a moving average line overlaid on the volume histogram).
- Volume and Price Trends:
- Uptrend with increasing volume: If prices are rising and volume is growing, it suggests strong buying interest and a sustainable trend.
- Uptrend with decreasing volume: If prices rise but volume drops, it may indicate weakening momentum and a potential reversal.
- Downtrend with increasing volume: Falling prices with rising volume signal strong selling pressure.
- Downtrend with decreasing volume: Declining volume during a price drop might suggest selling is drying up, hinting at a possible bottom.
- Spikes in Volume:
- Sudden, sharp increases in volume often occur during major news events, earnings reports, or breakouts/breakdowns. These spikes can confirm the significance of a price move.
- For example, a breakout above resistance with high volume is more likely to succeed than one with low volume.
- Divergences:
- If price makes a new high but volume is lower than during the previous high, it could signal a lack of conviction—a bearish divergence.
- Conversely, a new low in price with lower volume than the prior low might indicate fading selling pressure—a bullish divergence.
- Average Volume:
- Many platforms display a moving average of volume (e.g., 20-day average). If current volume exceeds this average, it’s a sign of unusual activity.
How to Use Volume in Trading?
Volume is a versatile tool that can enhance your trading strategy. Here are some practical ways to apply it:
- Confirming Trends:
- Use volume to validate price trends. A strong uptrend or downtrend accompanied by rising volume is more reliable than one with flat or declining volume.
- Example: If a stock breaks out of a consolidation pattern on high volume, it’s a stronger signal to enter a trade.
- Spotting Reversals:
- Look for exhaustion signals. For instance, a sharp price drop with a massive volume spike might indicate “capitulation”—where sellers give up—often marking a bottom.
- Similarly, a price surge with a volume climax could signal euphoria and a potential top.
- Breakouts and Breakdowns:
- Volume is key to confirming breakouts (price moving above resistance) or breakdowns (price falling below support). High volume increases the odds of a successful move, while low volume suggests a “fakeout.”
- Example: If a stock breaks a key resistance level on triple its average volume, it’s a bullish sign.
- Accumulation and Distribution:
- Volume can reveal whether “smart money” (institutional investors) is accumulating (buying) or distributing (selling) an asset.
- Gradual price increases on steady, above-average volume suggest accumulation. Sharp price drops on high volume might indicate distribution.
- Volume-Based Indicators:
- Combine volume with indicators like:
- On-Balance Volume (OBV): Tracks cumulative volume to confirm price trends.
- Volume Weighted Average Price (VWAP): Shows the average price weighted by volume, often used by day traders to gauge value.
- Accumulation/Distribution Line: Measures buying and selling pressure over time.
- Combine volume with indicators like:
Conclusion
Volume is like the heartbeat of the market—it tells you how alive a price move really is. By learning to read and interpret volume alongside price action, you can gain a deeper understanding of market dynamics and improve your trading decisions. Whether you’re a day trader looking for quick breakouts or a swing trader hunting for trend reversals, volume offers a window into the intentions of other market participants. Start by observing volume patterns on your charts, and over time, you’ll develop an intuitive sense of how to use it to your advantage.
Happy trading!