
The Rate of Change (ROC) is a powerful yet straightforward concept used in mathematics, physics, economics, and especially in trading. In its simplest form, it measures how quickly one variable changes in relation to another—typically over time. In the context of trading, ROC is a momentum indicator that helps traders analyze the speed at which a stock’s price (or another asset’s value) is increasing or decreasing. This article will break down what ROC is, how it works, how to interpret it, and how traders can use it to make informed decisions.
What is Rate of Change?
The Rate of Change is a metric that quantifies the percentage change in a value over a specific period. In trading, it’s most commonly applied to price data, showing how much an asset’s price has shifted compared to a previous point in time. Essentially, it’s a way to gauge momentum—whether a price is accelerating, decelerating, or maintaining its trajectory.
The formula for ROC is simple: ROC = [(Current Value – Value n periods ago) / Value n periods ago] × 100
- Current Price: The price of the asset at the present moment.
- Price n Periods Ago: The price of the asset at a specified earlier time (e.g., 10 days ago, 20 minutes ago, etc., depending on the timeframe).
- n: The number of periods (days, hours, etc.) you’re comparing.
The result is expressed as a percentage, making it easy to compare across different assets or timeframes.
How Does Rate of Change Work?
ROC operates as a momentum oscillator, meaning it fluctuates around a central baseline—typically zero. Here’s how it behaves:
- Positive ROC: When the current price is higher than the price n periods ago, ROC is positive, indicating upward momentum.
- Negative ROC: When the current price is lower than the price n periods ago, ROC is negative, signaling downward momentum.
- Zero ROC: When the current price equals the price n periods ago, ROC is zero, suggesting no net change or a potential pause in momentum.
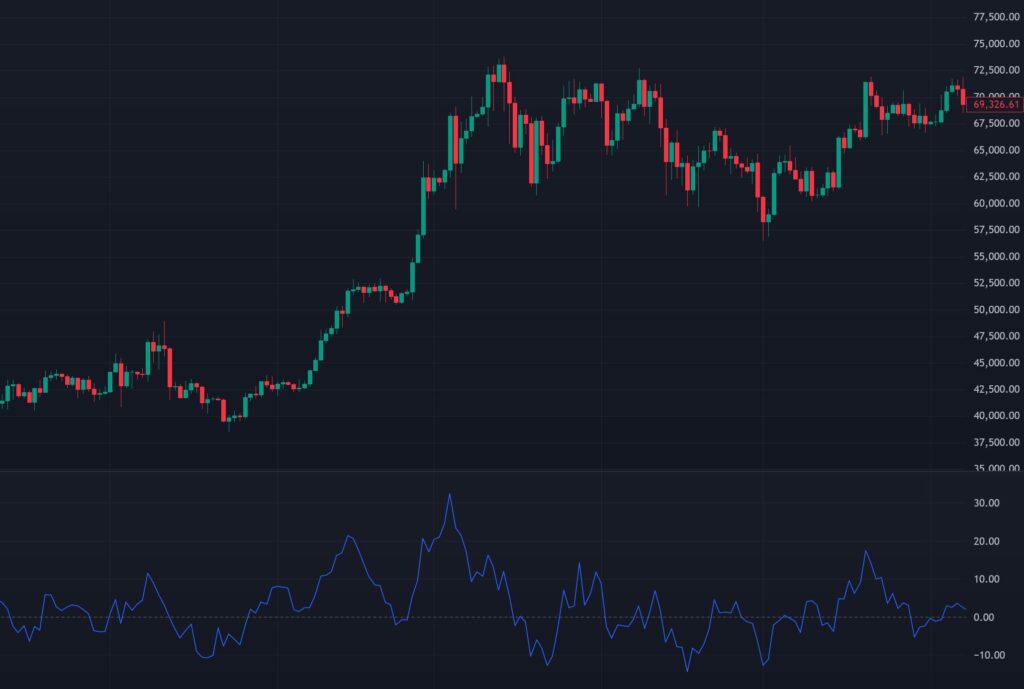
The indicator is usually plotted as a line graph below a price chart, oscillating above and below the zero line. Traders can adjust the look-back period (n) based on their strategy—shorter periods (e.g., 5 or 10 days) for short-term trading, longer periods (e.g., 50 or 200 days) for long-term trends.
How to Read Rate of Change?
Interpreting ROC involves understanding its position, direction, and magnitude:
- Position Relative to Zero:
- Above zero: The price is rising, and bullish momentum is present.
- Below zero: The price is falling, and bearish momentum dominates.
- Direction of the Line:
- Moving upward: Momentum is increasing (even if still negative, it could signal a slowing decline).
- Moving downward: Momentum is decreasing (even if still positive, it could hint at a weakening rally).
- Magnitude:
- A larger ROC (e.g., +20% or -15%) indicates strong momentum, often seen during breakouts or sharp reversals.
- A smaller ROC (e.g., +2% or -1%) suggests weaker momentum, possibly consolidation or indecision.
Traders also watch for divergences:
- Bullish Divergence: If the price is making lower lows, but ROC is making higher lows, it could signal a reversal to the upside.
- Bearish Divergence: If the price is making higher highs, but ROC is making lower highs, it might indicate an impending downturn.
Using Rate of Change in Trading
ROC is a versatile tool that traders can incorporate into various strategies. Here are some practical applications:
- Identifying Momentum:
- A sharply rising ROC above zero can confirm a strong uptrend, encouraging traders to buy or hold.
- A steeply falling ROC below zero may signal a downtrend, prompting a sell or short position.
- Spotting Overbought or Oversold Conditions:
- Extremely high ROC values (e.g., +30% or more, depending on the asset) might suggest an overbought condition, where a pullback could be imminent.
- Extremely low ROC values (e.g., -30% or more) could indicate an oversold condition, potentially a buying opportunity.
- Confirming Trends:
- Pair ROC with other indicators (like moving averages) to confirm trend direction. For instance, a positive ROC alongside a price above its 50-day moving average strengthens a bullish case.
- Timing Entries and Exits:
- A crossover above the zero line can signal a buy opportunity as momentum shifts upward.
- A crossover below the zero line might suggest it’s time to sell or short as momentum turns negative.
- Divergence Trading:
- Use divergences between ROC and price to anticipate reversals. For example, a bullish divergence might prompt a trader to enter a long position before the price fully reverses.
Practical Tips for Traders
- Choose the Right Period: The look-back period (n) depends on your trading style. Day traders might use 5-minute or 10-minute ROC, while swing traders might prefer 10-day or 20-day ROC.
- Combine with Other Tools: ROC is most effective when used alongside indicators like RSI, MACD, or support/resistance levels to avoid false signals.
- Context Matters: A high ROC in a volatile market might not mean the same as in a stable one—always consider the broader market environment.
Conclusion
The Rate of Change is a dynamic indicator that offers traders a window into price momentum. By measuring how fast prices are shifting, it helps identify trends, reversals, and potential entry or exit points.
Happy Trading!