
The Parabolic SAR (Stop and Reverse) is a popular technical analysis tool used by traders to identify potential trend directions, reversals, and exit points in the market. Developed by J. Welles Wilder Jr., the same mind behind indicators like the Relative Strength Index (RSI) and Average True Range (ATR), the Parabolic SAR is particularly valued for its simplicity and effectiveness in trending markets. In this article, we’ll explore what the Parabolic SAR is, how it works, how to interpret it, and how traders can use it in their strategies.
What is Parabolic SAR?
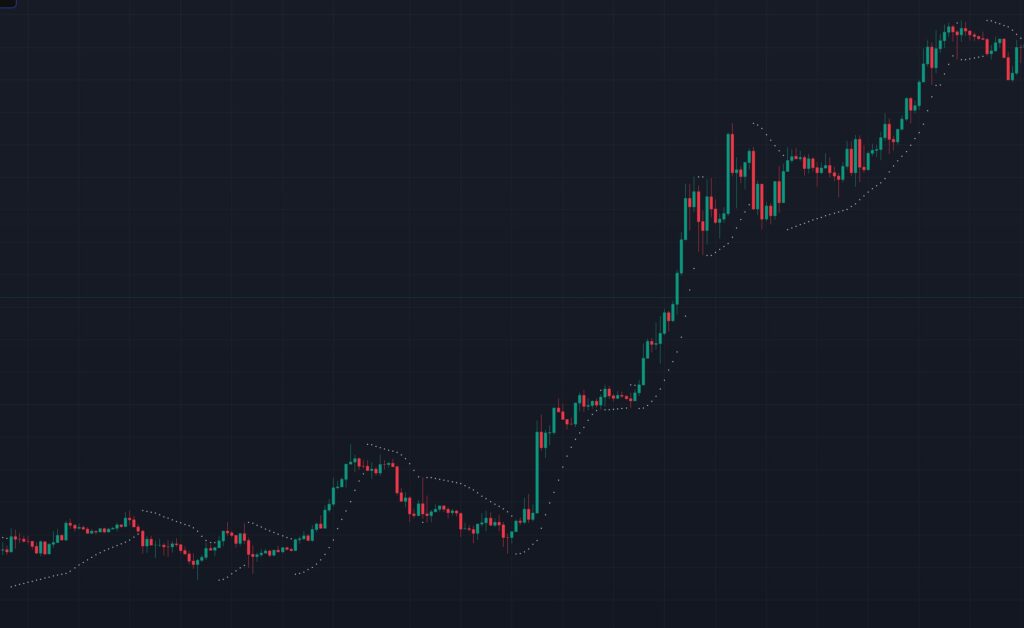
The Parabolic SAR is a trend-following indicator that plots a series of dots (or points) on a price chart, either above or below the price action. The term “parabolic” refers to the shape these dots form over time, which resembles a curve accelerating as the trend progresses. “SAR” stands for “Stop and Reverse,” indicating its dual purpose: it signals when to stop a trade and potentially reverse direction to catch a new trend.
Unlike many indicators that oscillate within a range, the Parabolic SAR is designed to stay with the trend, providing dynamic support or resistance levels. It’s commonly used in markets like stocks, forex, commodities, and cryptocurrencies to gauge momentum and manage trades.
How Does Parabolic SAR Work?
The Parabolic SAR calculation is based on two key components: price and time. It uses a formula that incorporates an acceleration factor (AF) and the extreme price (EP) of the trend to plot its dots. Here’s a simplified breakdown of how it works:
- Initial Positioning:
- When a new trend begins, the SAR starts either below the price (in an uptrend) or above it (in a downtrend).
- The initial SAR value is based on the prior trend’s extreme price (the highest high or lowest low).
- Acceleration Factor (AF):
- The AF starts at a default value of 0.02 and increases by 0.02 each time the price reaches a new extreme (e.g., a higher high in an uptrend), up to a maximum of 0.20.
- This acceleration causes the SAR to move closer to the price over time, forming the parabolic curve.
- Formula:
- SAR (next period) = SAR (current period) + [AF × (EP – SAR (current period))]
- EP = Extreme Price (highest high in an uptrend or lowest low in a downtrend).
- Reversal Signal:
- When the price crosses the SAR (e.g., price falls below the SAR in an uptrend), the indicator flips to the opposite side of the price and resets, signaling a potential trend reversal.
The result is a series of dots that trail the price, accelerating as the trend strengthens and flipping sides when the trend reverses.
How to Read Parabolic SAR?
Reading the Parabolic SAR is straightforward once you understand its visual cues. Here’s how to interpret it:
- Uptrend (Bullish Signal):
- Dots appear below the price candles.
- This suggests the trend is upward, and traders might consider buying or holding long positions.
- The dots act as a trailing stop-loss level, moving closer to the price as the trend continues.
- Downtrend (Bearish Signal):
- Dots appear above the price candles.
- This indicates a downward trend, suggesting traders might sell or hold short positions.
- The dots serve as a resistance level and trailing stop for short trades.
- Reversal Points:
- When the price crosses the SAR dots (e.g., from above to below or vice versa), it signals a potential trend reversal.
- For example, if the price drops below the SAR in an uptrend, the dots flip above the price, indicating a possible downtrend.
- Trend Strength:
- The distance between the SAR and the price can hint at momentum. A widening gap suggests a strong trend, while a narrowing gap may indicate weakening momentum or an impending reversal.
How to Use Parabolic SAR in Trading?
The Parabolic SAR is versatile and can be applied in various trading strategies. Here are some practical ways to use it:
- Trend Confirmation:
- Use the SAR to confirm the direction of a trend before entering a trade. For instance, only take long positions when the dots are below the price.
- Combine it with other indicators like moving averages or the ADX (Average Directional Index) to filter out false signals.
- Trailing Stop-Loss:
- The SAR’s primary function is as a trailing stop. As the dots move closer to the price, traders can adjust their stop-loss levels accordingly to lock in profits while staying in the trend.
- Example: In an uptrend, set your stop-loss just below the SAR dot and update it as the dot rises.
- Reversal Trading:
- Trade potential reversals when the price crosses the SAR. For example, if the price falls below the SAR after an uptrend, consider closing a long position and opening a short one.
- Be cautious, as reversals can be whipsawed in choppy markets—confirm with volume or another indicator.
- Avoiding Choppy Markets:
- The Parabolic SAR works best in trending markets and can generate false signals in sideways or ranging conditions. To avoid this, check the ADX or Bollinger Bands to ensure the market is trending before relying on SAR signals.
Pros and Cons of Parabolic SAR
Advantages:
- Easy to interpret with clear buy/sell signals.
- Effective in strong trending markets.
- Provides dynamic stop-loss levels, reducing guesswork.
Limitations:
- Prone to false signals in choppy or sideways markets.
- Lags slightly behind price action (like most trend-following tools).
- Requires adjustment of the AF settings for different assets or timeframes.
Conclusion
The Parabolic SAR is a powerful yet simple tool for traders looking to ride trends and manage risk. By plotting dynamic support and resistance levels, it helps identify trend direction, potential reversals, and exit points. However, its effectiveness shines in trending markets, so pairing it with other indicators can enhance its reliability.
Happy Trading!