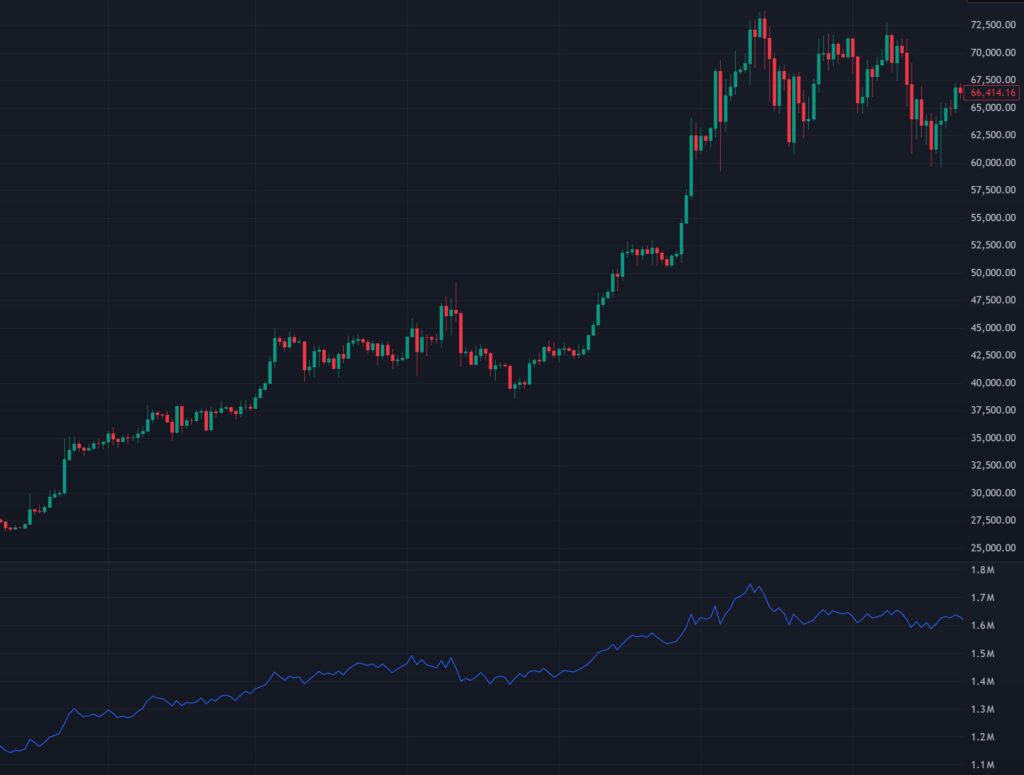
On-Balance Volume (OBV) is a widely used technical analysis indicator that combines price movement and trading volume to gauge the strength of buying and selling pressure in a market. Developed by Joseph Granville in the 1960s, OBV is a momentum-based tool that helps traders confirm trends, spot potential reversals, and identify divergences. In this article, we’ll dive into what OBV is, how it works, how to interpret its signals, and how traders can incorporate it into their strategies.
What is On-Balance Volume (OBV)?
On-Balance Volume is a cumulative indicator that measures the flow of volume in relation to price changes. The core idea behind OBV is that volume precedes price movement—when significant volume accompanies a price increase or decrease, it signals stronger conviction in that direction. Unlike price-based indicators like moving averages, OBV focuses on the accumulation or distribution of volume, making it a favorite among traders in markets such as stocks, forex, and cryptocurrencies.
OBV is plotted as a single line on a chart, typically below the price action, and its value rises or falls based on whether the price closes higher or lower than the previous period.

How Does On-Balance Volume Work?
The calculation of OBV is simple and relies on three basic rules that adjust its value based on the closing price and volume of each period (e.g., day, hour):
- If the current closing price is higher than the previous closing price:
- OBV = Previous OBV + Current Period’s Volume
- All of the day’s volume is added to the running total, reflecting buying pressure.
- If the current closing price is lower than the previous closing price:
- OBV = Previous OBV – Current Period’s Volume
- All of the day’s volume is subtracted from the running total, indicating selling pressure.
- If the current closing price equals the previous closing price:
- OBV = Previous OBV (no change)
- The volume is considered neutral and doesn’t affect the OBV.
The starting point for OBV is arbitrary (often set at zero or a positive number), as it’s the trend and direction of the line that matter, not its absolute value. Over time, OBV creates a cumulative total that reflects the net buying or selling pressure.
How to Read On-Balance Volume?
Interpreting OBV involves analyzing its direction, trend, and relationship to price action. Here’s how to read it:
- Rising OBV:
- When OBV is trending upward, it suggests that volume is supporting higher prices, indicating strong buying pressure.
- This often confirms an uptrend in the price chart.
- Falling OBV:
- A downward-trending OBV indicates that volume is accompanying lower prices, reflecting selling pressure.
- This typically confirms a downtrend.
- Divergence:
- Bullish Divergence: If the price is making lower lows but OBV is rising or flattening, it suggests buying pressure is building despite the price decline—a potential reversal signal.
- Bearish Divergence: If the price is making higher highs but OBV is falling or stalling, it indicates weakening buying pressure and a possible downturn.
- Trend Confirmation:
- When OBV moves in the same direction as the price (e.g., both rising in an uptrend), it confirms the trend’s strength.
- A flat or choppy OBV during a price trend may signal weak momentum.
Since OBV is cumulative, its absolute value isn’t as important as its slope and pattern over time.
How to Use OBV in Trading?
OBV is a versatile tool that traders can use for trend confirmation, reversal signals, and risk management. Here are some practical applications:
- Trend Confirmation:
- Use OBV to validate price trends. For example, enter a long position in an uptrend only if OBV is also rising, confirming that volume supports the move.
- Combine OBV with indicators like moving averages or the Relative Strength Index (RSI) for stronger confirmation.
- Spotting Divergences:
- Look for divergences between OBV and price to anticipate reversals. For instance, if a stock’s price hits a new high but OBV fails to follow, it might be time to sell or avoid entering a long position.
- Example: Bitcoin rises from $50,000 to $55,000, but OBV trends downward—consider this a bearish warning.
- Breakout Confirmation:
- When price breaks above resistance or below support, check OBV for confirmation. A rising OBV during a breakout above resistance suggests a sustainable move, while a falling OBV might indicate a false breakout.
- This is especially useful in volatile markets like forex or crypto.
- Early Warning System:
- OBV can act as a leading indicator. A sharp rise or fall in OBV before a significant price move often signals that smart money (institutional traders) is accumulating or distributing, giving you an edge.
Pros and Cons of OBV
Advantages:
- Simple to calculate and interpret.
- Incorporates volume, offering insight into market conviction.
- Effective for spotting divergences and confirming trends.
Limitations:
- Lags slightly, as it’s based on closing prices.
- Less effective in low-volume or choppy markets where price and volume lack clear direction.
- Doesn’t account for intraday price fluctuations—only closing prices matter.
Conclusion
On-Balance Volume is a powerful yet straightforward indicator that bridges the gap between price action and volume. By tracking the flow of buying and selling pressure, OBV helps traders confirm trends, identify potential reversals, and avoid weak moves. While it’s not a standalone tool—pairing it with other indicators enhances its reliability—it’s an invaluable addition to any trader’s toolkit. Whether you’re trading stocks, forex, or cryptocurrencies, experimenting with OBV can provide deeper insights into market dynamics.
Happy Trading!

