
Bollinger Bands are a popular technical analysis tool used by traders to assess market volatility, identify trends, and spot potential trading opportunities. Developed by John Bollinger in the 1980s, this indicator combines a moving average with dynamic bands that adjust to price fluctuations. Here’s a breakdown of what Bollinger Bands are, how they function, how to interpret them, and how traders can use them effectively.
What Are Bollinger Bands?
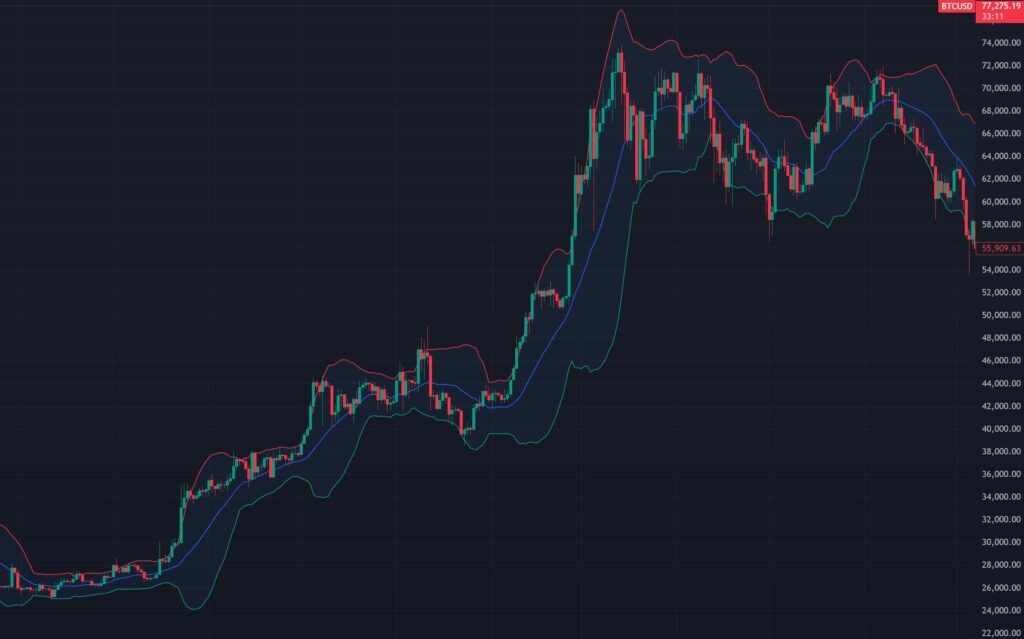
Bollinger Bands consist of three lines plotted on a price chart:
- Middle Band: A simple moving average (SMA), typically set to a 20-day period, though this can be adjusted.
- Upper Band: Calculated by adding a multiple (usually 2) of the standard deviation of price to the middle band.
- Lower Band: Calculated by subtracting the same multiple of the standard deviation from the middle band.
The formula is:
- Upper Band = SMA + (Standard Deviation × Multiplier)
- Lower Band = SMA – (Standard Deviation × Multiplier)
The standard deviation measures how much the price deviates from the average, making the bands widen during volatile periods and contract when volatility decreases. This adaptability sets Bollinger Bands apart from static indicators.
How Do Bollinger Bands Work?
Bollinger Bands reflect market volatility and price behavior:
- Expansion: When prices become more volatile, the bands widen as the standard deviation increases.
- Contraction: In calmer markets, the bands narrow, signaling lower volatility.
Statistically, about 95% of price action occurs within the bands when using a 20-day SMA and a multiplier of 2 (based on a normal distribution). This containment helps traders gauge whether prices are relatively high or low.
How to Read Bollinger Bands?
Reading Bollinger Bands involves observing price interactions with the bands and their width:
- Price Near the Upper Band: Indicates the asset may be overbought (priced high relative to its recent average). It’s not an automatic sell signal but suggests caution.
- Price Near the Lower Band: Suggests the asset may be oversold (priced low), potentially signaling a buying opportunity.
- Band Squeeze: When the bands contract tightly, it often precedes a significant price move—up or down—as low volatility periods typically give way to breakouts.
- Breakouts: Prices moving beyond the bands (above the upper or below the lower) can indicate strong momentum, though it’s not a guaranteed trend continuation.
- Middle Band as Support/Resistance: The SMA often acts as a dynamic level where prices may bounce or reverse.
How to Use Bollinger Bands in Trading?
Bollinger Bands are versatile and can be applied in various trading strategies:
- Trend Identification:
- In an uptrend, prices tend to hug the upper band.
- In a downtrend, prices stay near the lower band.
- Traders can use this to confirm trend direction alongside other indicators like the Relative Strength Index (RSI).
- Reversal Trades:
- When prices touch or exceed the upper band and show signs of exhaustion (e.g., a candlestick reversal pattern), traders might short or sell.
- Conversely, a bounce from the lower band with bullish signals could prompt a buy.
- Breakout Trades:
- A squeeze (narrow bands) signals a potential breakout. Traders watch for a strong move outside the bands, often combining this with volume analysis to confirm momentum.
- Mean Reversion:
- If prices deviate far from the middle band (SMA) and volatility is high, traders may anticipate a return to the average, especially in range-bound markets.
Tips and Limitations
- Combine with Other Tools: Bollinger Bands work best alongside indicators like RSI, MACD, or support/resistance levels to avoid false signals.
- Avoid Overreliance: Prices can “ride” the bands during strong trends, so overbought/oversold signals aren’t always reversals.
- Customize Settings: Adjust the SMA period (e.g., 50-day for longer trends) or multiplier (e.g., 1.5 for tighter bands) based on your trading style.
Conclusion
Bollinger Bands are a powerful tool for visualizing volatility and price extremes, offering traders insights into potential reversals, breakouts, and trends. By understanding how to read their signals and applying them strategically, traders can enhance decision-making in stocks, forex, crypto, or any market. Practice on a demo account or backtest strategies to master their use—volatility is your ally with Bollinger Bands!