
The triple bottom is a bullish chart pattern used in technical analysis to signal a potential reversal from a downtrend to an uptrend. This pattern is highly regarded by traders for its reliability in identifying key support levels and forecasting price breakouts. In this article, we’ll explore what a triple bottom is, how it works, how to read it, and how traders can use it effectively in their strategies.
What is a Triple Bottom?
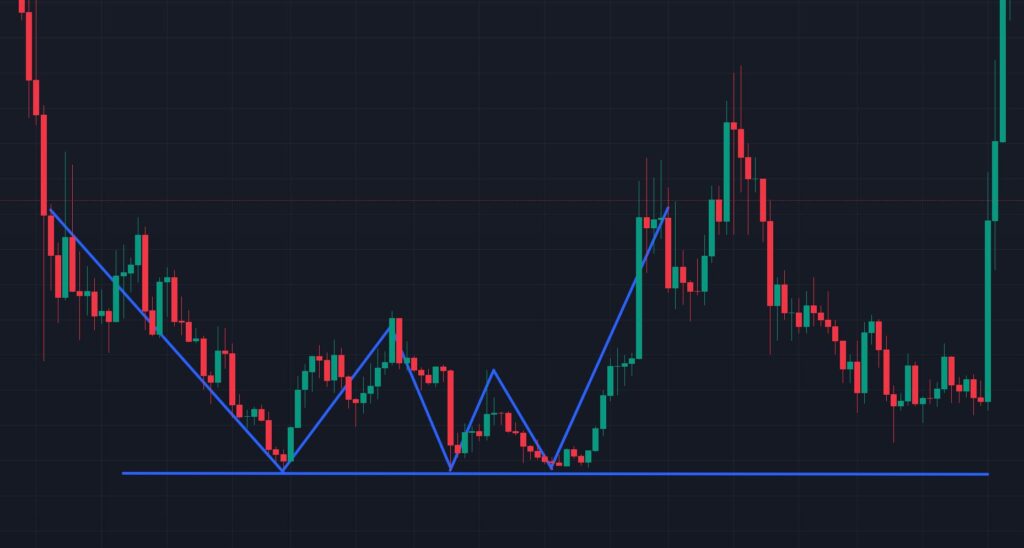
A triple bottom is a chart pattern that forms when the price of an asset (such as a stock, forex pair, or cryptocurrency) tests a specific support level three times without breaking below it. Each “bottom” represents a point where buying pressure overcomes selling pressure, preventing further price declines. The pattern typically appears after a prolonged downtrend and signals that the asset may be ready to reverse upward.
The triple bottom is characterized by:
- Three distinct lows at or near the same price level (the support zone).
- A resistance level (often called the “neckline”) formed by the highs between the bottoms.
- A breakout above the neckline, confirming the pattern and signaling a potential uptrend.
Visually, the triple bottom resembles the letter “W” with an additional dip, making it a variation of the double bottom pattern but with an extra test of support.
How Does a Triple Bottom Work?
The triple bottom reflects a battle between buyers and sellers at a key support level. Here’s how it unfolds:
- First Bottom: The price declines to a support level where buyers step in, halting the downtrend and causing a bounce.
- Second Bottom: The price revisits the support level, and buyers again defend it, leading to another bounce.
- Third Bottom: The price tests the support level a third time. If buyers hold firm, the price bounces again, signaling strong demand at this level.
- Breakout: As selling pressure weakens, the price breaks above the resistance (neckline) formed by the highs between the bottoms. This breakout confirms the pattern and suggests a shift to a bullish trend.
The triple bottom works because it demonstrates that sellers are losing momentum, and buyers are gaining control. The repeated failure to break below support builds confidence among traders that the price is unlikely to fall further, setting the stage for a rally.
How to Read a Triple Bottom?
Reading a triple bottom involves identifying its key components and confirming its validity. Here’s a step-by-step guide:
- Identify the Downtrend: The triple bottom forms after a sustained decline in price, so ensure the chart shows a clear downtrend before the pattern begins.
- Locate the Three Bottoms: Look for three distinct lows at roughly the same price level. These bottoms should be separated by bounces (price increases) and occur over a period of weeks or months (depending on the timeframe).
- Draw the Support Level: Connect the lows with a horizontal line to define the support zone. This level acts as the foundation of the pattern.
- Identify the Neckline: Connect the highs between the bottoms with a horizontal line. This resistance level is the neckline, and a breakout above it confirms the pattern.
- Confirm Volume Patterns: Volume often decreases with each successive bottom, indicating weakening selling pressure. During the breakout above the neckline, volume typically increases, confirming the bullish move.
- Assess the Timeframe: The triple bottom is more reliable on longer timeframes (e.g., daily or weekly charts) as it reflects significant market sentiment. On shorter timeframes (e.g., 1-hour charts), the pattern may be less reliable due to market noise.
- Watch for Confirmation: A breakout above the neckline, preferably on strong volume, confirms the pattern. Some traders wait for a retest of the neckline (now acting as support) before entering a trade.
How to Use the Triple Bottom in Trading?
The triple bottom is a powerful tool for traders looking to capitalize on trend reversals. Here’s how to incorporate it into your trading strategy:
1. Entry Points
- Breakout Entry: Enter a long position when the price breaks above the neckline with strong volume. This confirms the pattern and signals the start of a potential uptrend.
- Retest Entry: Some traders wait for the price to retest the neckline (now support) after the breakout. If the price holds above the neckline, it’s a safer entry point.
- Aggressive Entry: Experienced traders may enter near the third bottom, anticipating the breakout. This approach carries higher risk but offers a better reward-to-risk ratio if successful.
2. Setting Stop-Losses
- Place a stop-loss below the support level (the triple bottom lows) to protect against a false breakout or pattern failure. A common approach is to set the stop-loss 1-2% below the lowest bottom, depending on volatility.
- For tighter stops, consider placing the stop-loss below the most recent swing low before the breakout.
3. Profit Targets
- Measure the Pattern Height: Calculate the distance between the support level (bottoms) and the neckline. Add this distance to the breakout point to estimate a minimum price target. For example, if the support is at $50 and the neckline is at $60, the target would be $60 + ($60 – $50) = $70.
- Trailing Stops: Use trailing stops to lock in profits as the price moves higher, especially if the trend extends beyond the initial target.
4. Risk Management
- Ensure the risk-to-reward ratio is favorable (e.g., at least 1:2). For instance, if your stop-loss is $2 below the entry, aim for a profit target at least $4 above the entry.
- Avoid overleveraging, as false breakouts can occur, especially in volatile markets.
5. Combining with Other Indicators
- Moving Averages: Use moving averages (e.g., 50-day or 200-day) to confirm the trend direction. A breakout above the neckline that coincides with the price crossing above a key moving average strengthens the signal.
- Relative Strength Index (RSI): Look for bullish divergences on the RSI (higher lows in RSI while price forms the third bottom) to confirm buying pressure.
- Volume Analysis: A surge in volume during the breakout validates the pattern, while low volume may indicate a false breakout.
6. Avoiding False Breakouts
- Wait for a candlestick close above the neckline (e.g., on a daily chart) to confirm the breakout.
- Be cautious in choppy or low-liquidity markets, where false breakouts are more common.
- Monitor macroeconomic factors or news events that could disrupt the pattern.
Advantages and Limitations of the Triple Bottom
Advantages:
- Clear Signal: The pattern provides a well-defined setup with identifiable support, resistance, and breakout levels.
- High Reliability: When confirmed, the triple bottom often leads to significant price moves, especially on longer timeframes.
- Versatile: Applicable across various markets (stocks, forex, crypto) and timeframes.
Limitations:
- Time-Consuming: The pattern can take weeks or months to form, requiring patience.
- False Breakouts: Breakouts may fail if volume is weak or market conditions change.
- Subjectivity: Identifying the exact bottoms and neckline can vary between traders, leading to differing interpretations.
Conclusion
The triple bottom is a robust chart pattern that helps traders identify potential trend reversals with clear entry, exit, and risk management guidelines. By understanding its structure, confirming breakouts with volume and indicators, and applying sound trading principles, traders can use the triple bottom to capitalize on bullish opportunities. However, like all technical patterns, it’s not foolproof, so combining it with other tools and maintaining disciplined risk management is essential for success.
Happy Trading!