
The falling wedge is a powerful chart pattern used by traders to identify potential bullish reversals or continuations in financial markets. Recognizable by its converging trendlines sloping downward, this pattern often signals that selling pressure is weakening, paving the way for a price breakout to the upside. In this article, we’ll break down what a falling wedge is, how it works, how to read it, and how traders can use it effectively.
What is a Falling Wedge?
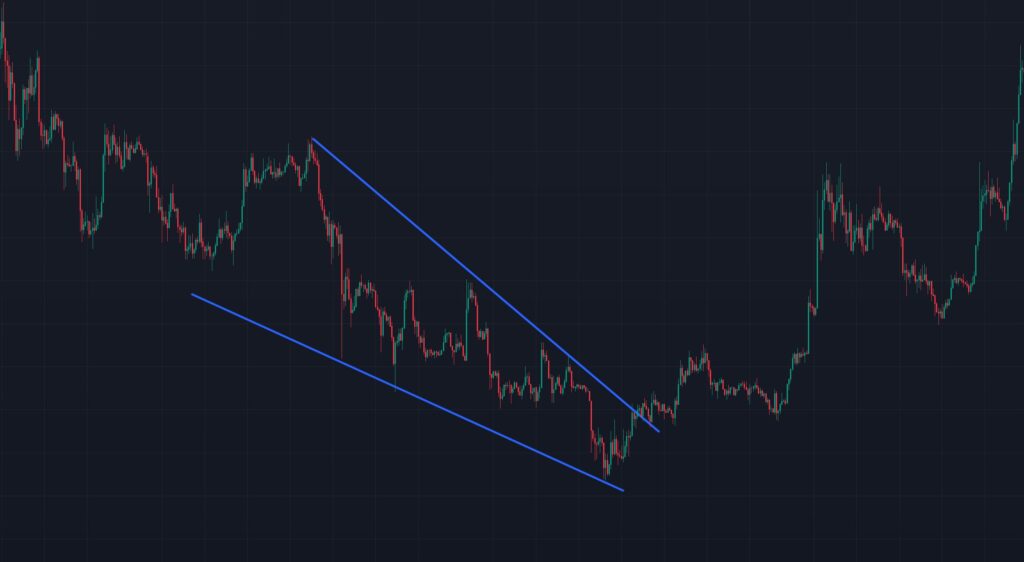
A falling wedge is a technical chart pattern characterized by two converging trendlines that slope downward, forming a wedge-like shape. It typically appears during a downtrend (as a reversal pattern) or within an uptrend (as a continuation pattern). The pattern reflects a gradual decrease in selling momentum, with lower highs and lower lows forming at a slower pace, hinting at an impending bullish move.
Key features:
- Upper trendline: Connects the lower highs, sloping downward.
- Lower trendline: Connects the lower lows, also sloping downward but at a steeper angle.
- Converging lines: The trendlines gradually come closer together, indicating decreasing volatility.
- Bullish implication: The pattern usually resolves with a breakout above the upper trendline, signaling a potential price rise.
How Does a Falling Wedge Work?
The falling wedge forms as sellers lose conviction, and buyers begin to step in, creating a tightening range of price action. Here’s the mechanics behind it:
- Downtrend Context (Reversal): In a downtrend, sellers initially dominate, pushing prices lower. However, as the wedge forms, each successive low is less severe, and highs are also lower, showing that sellers are exhausting their momentum.
- Uptrend Context (Continuation): In an uptrend, a falling wedge can act as a temporary pullback or consolidation, where profit-taking causes a brief decline before buyers resume control.
- Breakout Trigger: As the wedge narrows, volatility compresses. A breakout occurs when the price breaches the upper trendline, often accompanied by increased volume, confirming a shift to bullish momentum.
- Price Target: After the breakout, the price often rises by a distance roughly equal to the height of the wedge’s widest part or the prior trend’s magnitude.
The falling wedge is considered reliable because it reflects a battle between buyers and sellers, with buyers gaining the upper hand as the pattern completes.
How to Read a Falling Wedge?
Reading a falling wedge involves identifying its structure and confirming its signals. Here’s a step-by-step guide:
- Spot the Pattern:
- Look for a series of lower highs and lower lows on the chart.
- Draw two trendlines: one connecting the highs (resistance) and one connecting the lows (support).
- Ensure the trendlines converge, forming a wedge that slopes downward.
- Assess the Context:
- Downtrend: If the wedge appears after a prolonged decline, it’s likely a reversal pattern, signaling the end of the bearish phase.
- Uptrend: If it forms during a rally, it’s a continuation pattern, suggesting a pause before the uptrend resumes.
- Monitor Volume:
- Volume typically declines as the wedge forms, reflecting reduced selling pressure.
- A breakout above the upper trendline should ideally be accompanied by a spike in volume, validating the move.
- Watch for Breakout Confirmation:
- The breakout is confirmed when the price closes above the upper trendline, preferably with a strong candle (e.g., a bullish engulfing pattern).
- Be cautious of false breakouts; wait for a retest of the trendline (where it acts as support) for added confirmation.
- Measure the Price Target:
- Calculate the height of the wedge at its widest point (from the highest high to the lowest low).
- Add this distance to the breakout point to estimate the potential price target.
- Alternatively, use the length of the prior downtrend for reversal patterns to gauge the target.
- Look for Supporting Indicators:
- Relative Strength Index (RSI): An RSI moving out of oversold territory (below 30) can support a bullish breakout.
- Moving Averages: A price crossing above a key moving average (e.g., 50-day MA) post-breakout adds confidence.
- MACD: A bullish crossover in the MACD can align with the wedge’s breakout signal.
How to Use a Falling Wedge for Trading?
The falling wedge offers actionable trading opportunities, but success depends on proper execution and risk management. Here’s how to trade it effectively:
- Entry Points:
- Breakout Entry: Enter a long position when the price breaks and closes above the upper trendline, ideally with high volume.
- Pullback Entry: Wait for the price to retest the broken trendline (now acting as support) before entering, reducing the risk of a false breakout.
- Early Entry (Aggressive): Some traders enter within the wedge near the lower trendline, anticipating a bounce, but this carries higher risk.
- Stop-Loss Placement:
- Place a stop-loss below the lower trendline or the most recent swing low within the wedge to protect against a breakdown.
- For breakout trades, a stop below the breakout candle’s low can work for tighter risk control.
- Take-Profit Targets:
- Use the wedge’s height to set a conservative target.
- For reversal patterns, consider the prior downtrend’s length for a more ambitious target.
- Alternatively, trail stops using moving averages or Fibonacci extensions to capture larger moves.
- Risk Management:
- Risk no more than 1-2% of your account per trade to limit losses.
- Ensure the risk-reward ratio is at least 1:2 (e.g., risking $100 to make $200).
- Avoid trading falling wedges in choppy markets, as they’re less reliable without a clear trend.
- Combine with Other Tools:
- Use Fibonacci retracement levels to confirm support zones within the wedge.
- Check for divergence in oscillators (e.g., RSI showing higher lows while price makes lower lows) to strengthen the bullish case.
- Align the trade with broader market trends for higher probability setups.
- Timeframe Considerations:
- Falling wedges can form on any timeframe, but longer timeframes (e.g., daily or weekly) tend to produce more reliable signals.
- Day traders can use shorter timeframes (e.g., 1-hour or 15-minute) but should be cautious of noise and false breakouts.
Common Pitfalls to Avoid
- False Breakouts: Always wait for confirmation (e.g., a close above the trendline or a retest) to avoid getting trapped.
- Ignoring Volume: A breakout without volume support is less reliable.
- Overtrading: Don’t force trades in unclear patterns or volatile markets.
- Neglecting Context: A falling wedge in a strong bear market may fail, so check the broader trend.
Conclusion
The falling wedge is a versatile and reliable pattern for traders seeking bullish opportunities. By understanding its structure, reading its signals, and applying disciplined trading strategies, you can harness its potential to capture profitable moves. Just remember to combine it with sound risk management and supporting indicators for the best results.
Happy trading!