
The double bottom is a popular chart pattern used in technical analysis to signal a potential reversal from a downtrend to an uptrend. Recognized for its distinctive “W” shape, this bullish pattern helps traders identify opportunities to enter long positions. In this article, we’ll explore what a double bottom is, how it works, how to read it, and how traders can use it effectively in their strategies.
What is a Double Bottom?
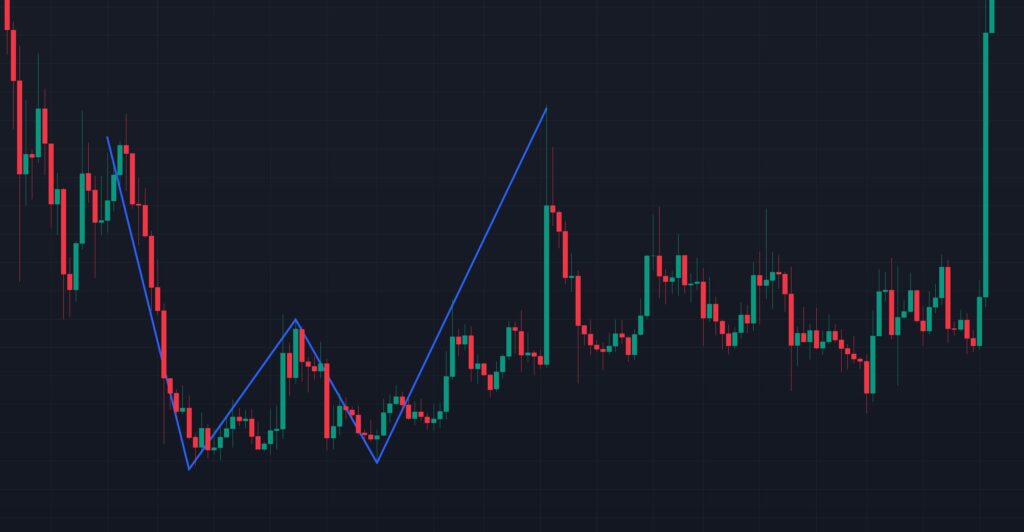
A double bottom is a bullish reversal pattern that forms after a sustained downtrend. It appears on a price chart when an asset’s price drops to a low, bounces back up, falls to a similar low, and then rises again, creating two distinct troughs or “bottoms” at roughly the same price level. The pattern resembles the letter “W” and indicates that the price has found strong support, suggesting that selling pressure is waning and buyers are stepping in.
The double bottom is considered a reliable pattern because it reflects a failed attempt by sellers to push the price lower, followed by a shift in momentum toward buyers. It’s commonly observed across various markets, including stocks, forex, cryptocurrencies, and commodities, and on different timeframes, from intraday to weekly charts.
How Does a Double Bottom Work?
The double bottom pattern unfolds in several stages:
- Downtrend: The price is in a clear decline, driven by selling pressure.
- First Bottom: The price reaches a low (support level) where buying interest emerges, halting the decline and causing a bounce.
- Pullback: The price rises temporarily, forming a peak (often called the “neckline” when connected later) before sellers attempt to push it down again.
- Second Bottom: The price falls back to a similar low as the first bottom, testing the support level. If buyers defend this level, the price bounces again.
- Breakout: The price rises past the neckline (the high between the two bottoms), confirming the pattern and signaling a potential trend reversal.
The pattern is complete only when the price breaks above the neckline, indicating that bullish momentum has overtaken bearish pressure. The distance between the bottoms and the neckline can help estimate the potential price target after the breakout.
How to Read a Double Bottom?
Reading a double bottom involves identifying its key components on a price chart and confirming its validity. Here’s a step-by-step guide:
- Identify the Downtrend: Look for a clear, sustained decline in price before the pattern forms. The double bottom is a reversal pattern, so it requires a preceding downtrend to be meaningful.
- Spot the Two Bottoms: Locate two troughs at roughly the same price level. These bottoms should be separated by a peak (the neckline level). The bottoms don’t need to be identical but should be close in price.
- Draw the Neckline: Connect the high point between the two bottoms with a horizontal line. This neckline acts as a resistance level that the price must break to confirm the pattern.
- Assess Volume: Volume often provides clues about the pattern’s strength. Ideally, volume decreases during the second bottom (indicating fading selling pressure) and spikes during the breakout above the neckline (showing strong buying interest).
- Confirm the Breakout: The pattern is confirmed when the price closes above the neckline, preferably on high volume. A weak breakout (e.g., low volume or hesitation) may suggest a false signal.
- Measure the Price Target: To estimate the potential move, measure the vertical distance from the bottoms to the neckline and project that distance upward from the breakout point. For example, if the bottoms are at $50 and the neckline is at $60, the target would be $60 + ($60 – $50) = $70.
Additional factors to consider:
- Timeframe: The pattern’s reliability increases on longer timeframes (e.g., daily or weekly charts).
- Context: Look for confluence with other technical indicators, such as moving averages, RSI, or support zones, to strengthen the signal.
- False Breakouts: Be cautious of premature breakouts or traps where the price briefly crosses the neckline but reverses.
How to Use a Double Bottom for Trading?
The double bottom pattern offers traders a structured way to capitalize on potential trend reversals. Here’s how to incorporate it into a trading strategy:
1. Entry Points
- Breakout Entry: Enter a long position when the price breaks above the neckline with a strong candle and increased volume. This confirms the pattern and reduces the risk of a false signal.
- Pullback Entry: Some traders wait for a pullback to the neckline after the breakout, as it often acts as new support. Enter if the price holds above the neckline and shows bullish momentum.
2. Stop-Loss Placement
- Place a stop-loss below the second bottom to protect against a failed pattern. For added safety, set it slightly below the lowest bottom to account for market noise.
- Alternatively, use a percentage-based stop (e.g., 1-2% below the second bottom) or place it below a nearby support level.
3. Profit Targets
- Use the measured move technique to set a target: Add the height of the pattern (neckline to bottom) to the breakout point.
- Consider partial profit-taking at key resistance levels or round numbers, especially if the target seems ambitious.
- Monitor momentum indicators (e.g., RSI or MACD) to gauge whether the trend is losing steam.
4. Risk Management
- Calculate the risk-reward ratio before entering. A double bottom trade typically offers a favorable ratio (e.g., 1:2 or better) if the stop-loss is tight and the target is realistic.
- Avoid overleveraging, as false breakouts can occur, especially in volatile markets.
5. Confirmation Tools
- Use additional indicators to validate the pattern:
- Moving Averages: A price breaking above a key moving average (e.g., 50-day or 200-day) alongside the neckline adds confidence.
- RSI: An RSI moving out of oversold territory (below 30) during the second bottom supports a bullish reversal.
- Volume: A surge in volume on the breakout strengthens the signal.
- Check for fundamental catalysts (e.g., earnings, news) that might support the reversal.
Tips for Success
- Patience is Key: Wait for a confirmed breakout before acting. Premature entries during the pattern’s formation are risky.
- Avoid Choppy Markets: Double bottoms work best in trending markets. In sideways markets, false signals are more common.
- Combine with Context: Use support/resistance levels, Fibonacci retracements, or news events to enhance the pattern’s reliability.
Potential Pitfalls
- False Breakouts: The price may briefly break the neckline but reverse. Use volume and candlestick patterns to filter weak signals.
- Overreliance on Patterns: No pattern is foolproof. Always combine the double bottom with other analysis tools.
- Ignoring Broader Trends: A double bottom on a short timeframe may fail if the broader market or asset is in a strong downtrend.
Conclusion
The double bottom is a powerful tool for traders seeking to capitalize on bullish reversals. By identifying the pattern’s “W” shape, confirming the breakout, and applying sound risk management, traders can use it to enter trades with favorable risk-reward profiles. However, success requires patience, discipline, and the use of complementary indicators to filter out false signals.
Happy Trading!