
In technical analysis, chart patterns play a crucial role in helping traders predict future price movements. One such pattern, the Bullish Pennant, is a powerful continuation pattern that signals the potential for an upward price breakout after a period of consolidation. This article explains what a Bullish Pennant is, how it works, how to read it, and how traders can use it effectively in their strategies.
What is a Bullish Pennant?
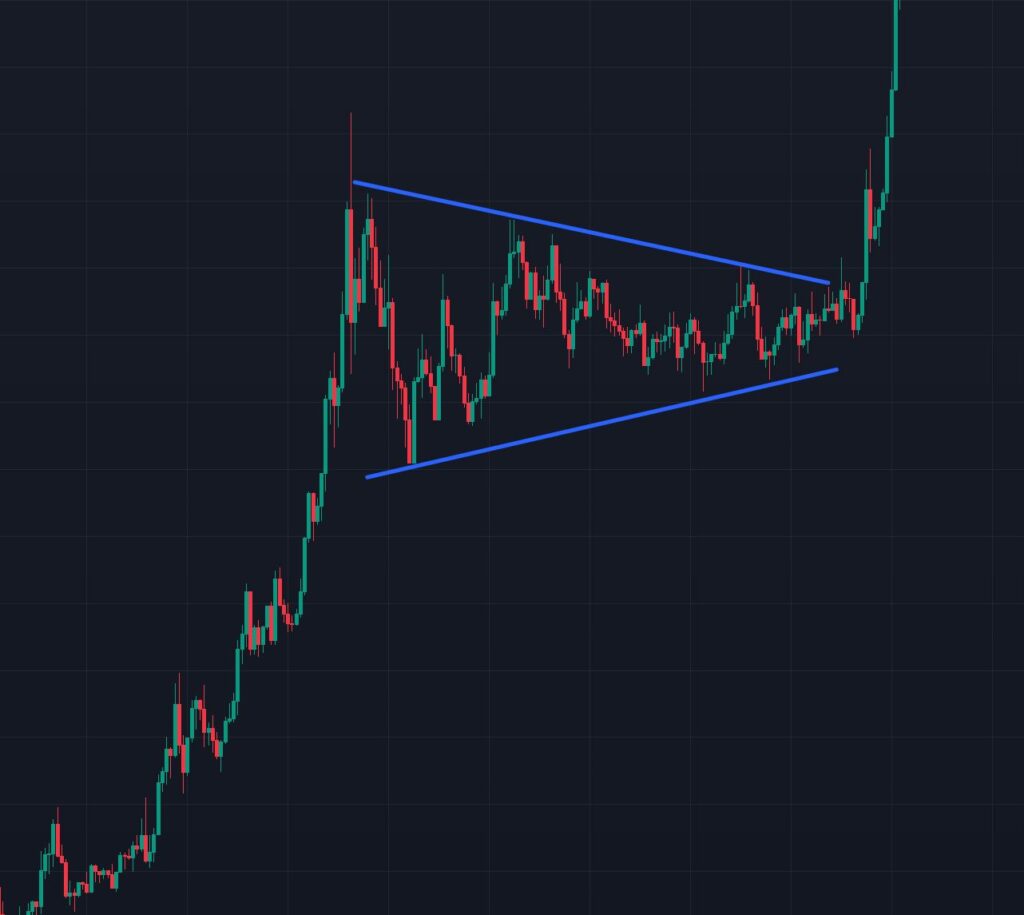
A Bullish Pennant is a chart pattern that forms after a strong upward price movement, indicating a pause or consolidation before the price continues its bullish trend. It belongs to the family of continuation patterns, meaning it typically signals that the prior trend (in this case, upward) will resume once the pattern completes.
The pattern resembles a small symmetrical triangle (the “pennant”) preceded by a sharp, nearly vertical price surge (the “flagpole”). The pennant forms as the price consolidates within converging trendlines, reflecting a temporary decrease in volatility as buyers and sellers reach a balance before the next breakout.
How Does a Bullish Pennant Work?
The Bullish Pennant reflects market psychology during a strong uptrend:
- Flagpole Formation: The pattern begins with a sharp, high-volume upward price movement, often triggered by positive news, earnings reports, or other catalysts. This creates the “flagpole” of the pattern.
- Consolidation Phase (Pennant): After the initial surge, the market enters a consolidation phase. Buyers take a breather, and some traders may take profits, leading to a tightening range of price action. The price forms a small symmetrical triangle as higher lows and lower highs converge, indicating reduced volatility.
- Breakout: Once the consolidation phase ends, the price typically breaks out above the upper trendline of the pennant, resuming the bullish trend. This breakout is often accompanied by increased volume, signaling renewed buying pressure.
The Bullish Pennant is considered a reliable pattern because it captures a brief pause in momentum, allowing traders to position themselves for the next leg of the uptrend.
How to Read a Bullish Pennant?
Identifying and interpreting a Bullish Pennant requires careful observation of price action and key characteristics. Here’s a step-by-step guide to reading the pattern:
- Spot the Flagpole:
- Look for a sharp, near-vertical price increase on strong volume. This indicates a strong bullish impulse and sets the stage for the pattern.
- The flagpole typically lasts a few days to a couple of weeks, depending on the timeframe.
- Identify the Pennant:
- After the flagpole, the price begins to consolidate, forming a small symmetrical triangle. This is characterized by:
- Converging trendlines: Draw an upper trendline connecting the lower highs and a lower trendline connecting the higher lows.
- Decreasing volume: Volume tends to decline during the consolidation phase, reflecting reduced market activity.
- The pennant usually forms over 1–3 weeks (on daily charts), though the duration can vary by timeframe.
- After the flagpole, the price begins to consolidate, forming a small symmetrical triangle. This is characterized by:
- Confirm the Breakout:
- Watch for the price to break above the upper trendline of the pennant, ideally with a strong candlestick (e.g., a bullish engulfing candle).
- A surge in volume during the breakout confirms the pattern’s validity.
- Be cautious of false breakouts, where the price briefly moves above the trendline but fails to sustain the move.
- Measure the Price Target:
- To estimate the potential price move after the breakout, measure the length of the flagpole (from the base to the peak).
- Add this distance to the breakout point (where the price breaks above the pennant’s upper trendline) to project the target.
- Assess the Context:
- Ensure the pattern forms in a clear uptrend. A Bullish Pennant in a downtrend or sideways market may not be reliable.
- Look for supporting indicators, such as a rising moving average or bullish momentum signals, to increase confidence.
How to Use a Bullish Pennant for Trading?
The Bullish Pennant offers traders a structured way to capitalize on continuation moves. Here’s how to incorporate it into your trading strategy:
1. Entry Points
- Breakout Entry: Enter a long position when the price breaks above the upper trendline of the pennant with strong volume. This confirms the resumption of the uptrend.
- Early Entry (Aggressive): Some traders enter during the consolidation phase, near the lower trendline of the pennant, anticipating the breakout. This approach carries higher risk but offers a better entry price.
- Use a candlestick close above the trendline (e.g., on a daily chart) to avoid false breakouts.
2. Stop-Loss Placement
- Place a stop-loss below the lower trendline of the pennant or the most recent swing low within the pattern. This protects against a failed breakout or reversal.
- Adjust the stop-loss based on your risk tolerance and the asset’s volatility.
3. Profit Targets
- Calculate the price target by measuring the flagpole’s height and projecting it upward from the breakout point.
- Alternatively, use trailing stops to capture additional gains if the trend extends beyond the initial target.
- Consider partial profit-taking at key resistance levels to lock in gains.
4. Risk Management
- Risk only a small percentage of your capital (e.g., 1–2%) per trade to protect against losses.
- Ensure the risk-reward ratio is favorable (e.g., 1:2 or better) before entering the trade.
- Avoid trading pennants in choppy or low-volume markets, as they may lead to false signals.
5. Confirm with Indicators
- Use technical indicators to validate the pattern:
- Volume: Rising volume on the breakout confirms strength.
- Relative Strength Index (RSI): Ensure RSI is not overbought (e.g., above 70), as this could signal exhaustion.
- Moving Averages: A price above a rising 50-day or 200-day moving average supports the bullish context.
- Avoid relying solely on the pattern without considering the broader market trend.
6. Timeframe Considerations
- Bullish Pennants can form on any timeframe, from intraday (e.g., 5-minute charts) to weekly charts.
- Shorter timeframes are suitable for day traders, while longer timeframes (e.g., daily or weekly) are better for swing or position traders.
- Ensure the pattern’s duration aligns with your trading style (e.g., shorter pennants for faster trades).
Common Mistakes to Avoid
- Misidentifying the Pattern: Ensure the flagpole is sharp and the pennant is a tight, converging triangle. Mistaking a broader consolidation (e.g., a rectangle) for a pennant can lead to false signals.
- Ignoring Volume: A breakout without volume confirmation is less reliable. Always check for a volume spike.
- Chasing Breakouts: Entering too late after the breakout may reduce the reward potential or lead to buying at a peak.
- Neglecting the Trend: A Bullish Pennant in a downtrend or sideways market is less likely to succeed. Always confirm the broader uptrend.
- Overlooking False Breakouts: Wait for a candlestick close above the trendline to avoid premature entries.
Conclusion
The Bullish Pennant is a reliable and visually intuitive pattern that helps traders capitalize on continuation moves in an uptrend. By understanding its structure—flagpole, consolidation, and breakout—traders can identify high-probability setups with clear entry, exit, and risk management rules. When combined with volume analysis, technical indicators, and a disciplined approach, the Bullish Pennant can be a valuable tool for navigating bullish markets.
Happy Trading!