
The ascending triangle is a popular chart pattern used in technical analysis to predict potential price movements in financial markets. Known for its bullish bias, this pattern often signals that a breakout to the upside is likely. In this article, we’ll explore what an ascending triangle is, how it works, how to read it, and how traders can use it to make informed trading decisions.
What is an Ascending Triangle?
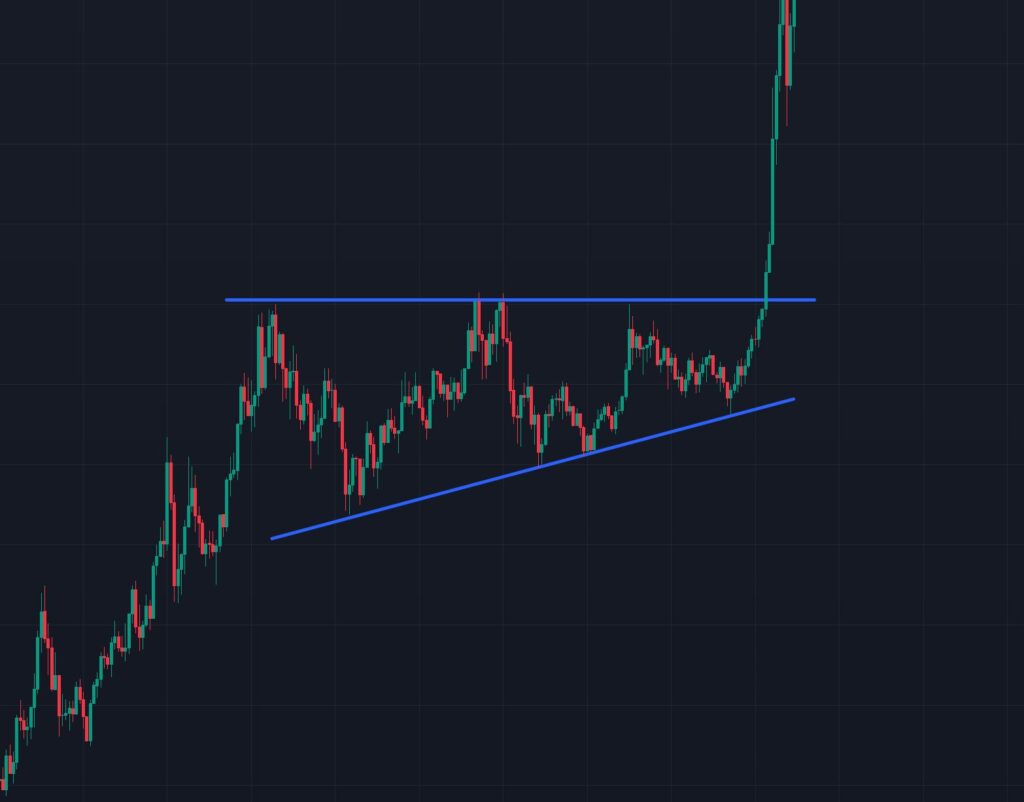
An ascending triangle is a type of continuation pattern that typically forms during an uptrend, indicating that the price is likely to continue moving higher after a period of consolidation. It is characterized by two key features on a price chart:
- Flat Upper Resistance Line: A horizontal line connecting a series of similar price highs, indicating a level where sellers repeatedly step in to cap upward movement.
- Rising Lower Support Line: A diagonal line connecting higher lows, showing that buyers are stepping in at progressively higher prices, demonstrating increasing demand.
The pattern resembles a triangle because the price oscillates between these two converging lines, with the range tightening as the pattern develops. The ascending triangle is considered bullish because the rising lows suggest stronger buying pressure, which often leads to a breakout above the resistance line.
How Does an Ascending Triangle Work?
The ascending triangle reflects a battle between buyers and sellers:
- Buyers: Each time the price dips, buyers enter the market at higher levels, creating the rising support line. This indicates growing confidence and willingness to buy at higher prices.
- Sellers: Sellers defend the upper resistance level, preventing the price from breaking higher initially. However, as the pattern progresses, selling pressure often weakens as buyers continue to push.
- Breakout: The pattern typically resolves with a breakout above the resistance line, as sellers are overwhelmed by persistent buying pressure. This breakout often leads to a sharp price increase, especially if accompanied by high trading volume.
While the ascending triangle is primarily a bullish pattern, false breakouts or reversals can occur, so traders must exercise caution and use additional tools to confirm signals.
How to Read an Ascending Triangle?
To identify and read an ascending triangle on a price chart, follow these steps:
- Spot the Pattern:
- Look for a horizontal resistance line formed by at least two similar highs.
- Identify a rising support line formed by at least two higher lows.
- The price should oscillate between these lines, forming a triangle shape.
- Assess the Trend:
- Confirm that the pattern is forming within an uptrend, as ascending triangles are most reliable as continuation patterns.
- If the pattern appears in a downtrend, it could still break out upward, but the signal is less reliable.
- Monitor Volume:
- Volume often decreases as the pattern forms, reflecting consolidation.
- A breakout accompanied by a surge in volume is a strong confirmation of the pattern’s validity.
- Watch for the Breakout:
- The breakout typically occurs when the price closes above the resistance line.
- Be cautious of false breakouts, where the price briefly moves above resistance but fails to sustain the move.
- Measure the Price Target:
- To estimate the potential price move after a breakout, measure the height of the triangle at its widest point (the vertical distance between the resistance and the lowest point of the support line).
- Add this height to the breakout point to project the target price.
How to Use the Ascending Triangle for Trading?
Traders can use the ascending triangle to plan entries, exits, and risk management. Here’s a step-by-step guide to trading this pattern:
- Entry Strategies:
- Breakout Entry: Enter a long position when the price closes above the resistance line, ideally with strong volume to confirm the breakout.
- Pullback Entry: If the price breaks out but pulls back to test the resistance line (now acting as support), consider entering on a bounce from this level.
- Early Entry: Aggressive traders may enter near the rising support line during the pattern’s formation, anticipating the breakout. This carries higher risk but offers a better reward-to-risk ratio.
- Stop-Loss Placement:
- Place a stop-loss below the rising support line or the most recent swing low within the triangle to protect against a breakdown.
- For breakout trades, a stop-loss just below the breakout candle’s low can minimize losses if the breakout fails.
- Profit Targets:
- Use the triangle’s height to set a price target, as described earlier.
- Alternatively, trail a stop-loss or use other technical indicators (e.g., Fibonacci extensions or prior resistance levels) to lock in profits.
- Confirmation Tools:
- Use indicators like the Relative Strength Index (RSI) or Moving Average Convergence Divergence (MACD) to confirm bullish momentum.
- Check volume trends to ensure the breakout is supported by strong buying interest.
- Consider candlestick patterns (e.g., a bullish engulfing candle) at the breakout point for added confidence.
- Risk Management:
- Never risk more than 1-2% of your trading capital on a single trade.
- Ensure the reward-to-risk ratio is at least 2:1 (e.g., aiming for a $2 gain for every $1 risked).
- Be prepared for false breakouts by keeping position sizes conservative.
Advantages and Limitations
Advantages:
- Easy to identify on charts.
- Provides clear entry, exit, and target levels.
- Reliable in strong uptrends, especially with high-volume breakouts.
Limitations:
- False breakouts can lead to losses if not confirmed.
- Less reliable in choppy or range-bound markets.
- Requires patience, as the pattern can take time to resolve.
Conclusion
The ascending triangle is a powerful tool for traders, offering a clear framework to capitalize on bullish price action. By understanding its structure, confirming breakouts with volume and indicators, and applying disciplined risk management, traders can use this pattern to enhance their strategies. However, like all technical patterns, it’s not foolproof, so combine it with other analysis methods and stay adaptable to market conditions.
Happy Trading!