
In the dynamic world of trading, recognizing chart patterns can unlock opportunities to predict market movements. The triple top is one such pattern, a bearish signal that alerts traders to a potential reversal from an uptrend to a downtrend. By mastering the triple top, traders can make informed decisions to capitalize on price declines. This article explores what a triple top is, how it forms, how to interpret it, and how to use it effectively in trading strategies.
What is a Triple Top?
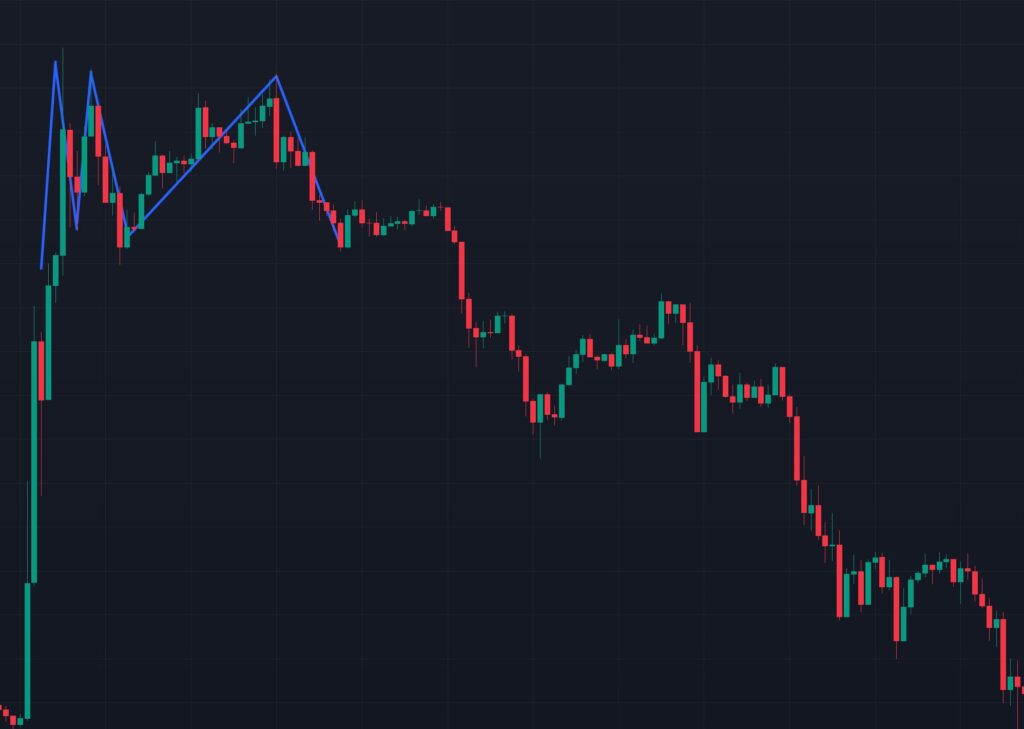
A triple top is a bearish reversal chart pattern observed in technical analysis, signaling a potential end to an uptrend and the beginning of a downtrend. It forms when the price of an asset reaches a similar high (resistance level) three times, fails to break through, and subsequently declines. The pattern resembles three peaks at roughly the same price level, often indicating that buyers are losing momentum and sellers are gaining control.
How Does a Triple Top Work?
The triple top pattern emerges after a sustained uptrend, where the price repeatedly tests a resistance level but cannot sustain upward momentum. Each peak represents an attempt by buyers to push the price higher, but the failure to break the resistance suggests weakening demand. After the third peak, the price typically breaks below a support level (the “neckline”), confirming the pattern and triggering a bearish move.
The pattern consists of:
- Three Peaks: Three high points at a similar price level, forming the resistance.
- Neckline: The support level connecting the lows between the peaks.
- Breakout: A decisive close below the neckline, signaling the start of a downtrend.
How to Read a Triple Top?
To identify and interpret a triple top, follow these steps:
- Confirm the Uptrend: Ensure the pattern forms after a clear upward price movement, as the triple top is a reversal pattern.
- Identify the Peaks: Look for three distinct highs at approximately the same price level. These peaks should be separated by pullbacks to a support level (the neckline).
- Draw the Neckline: Connect the lowest points between the peaks to form the neckline. This line acts as a critical support level.
- Watch for the Breakout: The pattern is confirmed when the price closes below the neckline after the third peak, ideally with increased volume, indicating strong selling pressure.
- Measure the Target: Calculate the potential price decline by measuring the vertical distance from the resistance (peaks) to the neckline. Subtract this distance from the neckline to estimate the downside target.
How to Use a Triple Top for Trading?
The triple top pattern can be a powerful tool for traders when used correctly. Here’s how to incorporate it into your trading strategy:
1. Entry Points
- Short Position: Enter a short trade (or sell) after the price breaks below the neckline with a strong candlestick close, preferably accompanied by high volume. This confirms the bearish reversal.
- Stop-Loss: Place a stop-loss above the neckline or the third peak to protect against false breakouts. A common approach is to set the stop-loss slightly above the resistance level (e.g., $100.50 if the peaks are at $100).
2. Price Targets
- Use the measured move technique described earlier to set a profit target. For instance, if the pattern’s height is $10, expect the price to decline by approximately $10 below the neckline.
- Be cautious, as markets may not always reach the exact target. Monitor price action and adjust based on additional signals.
3. Confirmation with Indicators
- Volume: A spike in volume during the neckline breakout strengthens the pattern’s reliability.
- Momentum Indicators: Use tools like the Relative Strength Index (RSI) or Moving Average Convergence Divergence (MACD) to confirm weakening momentum during the third peak.
- Support Levels: Check for historical support zones below the neckline, as they may act as barriers to the price decline.
4. Risk Management
- Always calculate the risk-reward ratio before entering a trade. For example, if your stop-loss is $2 above the neckline and the target is $10 below, the risk-reward ratio is 1:5, which is favorable.
- Avoid trading triple tops in choppy or low-volume markets, as false signals are more common.
5. Timeframes
- The triple top is effective across various timeframes, from intraday charts (e.g., 1-hour) to longer-term charts (e.g., daily or weekly). Longer timeframes generally produce more reliable signals but require more patience.
Limitations of the Triple Top
- False Breakouts: The price may briefly dip below the neckline and reverse, leading to losses if the stop-loss is too tight.
- Subjectivity: Identifying the exact peaks and neckline can be subjective, especially in volatile markets.
- Market Context: The pattern is less reliable in sideways markets or during major news events that disrupt trends.
Conclusion
The triple top is a valuable chart pattern for identifying potential reversals in uptrends. By understanding its structure, confirming breakouts with volume and indicators, and applying sound risk management, traders can use it to make informed decisions. However, always combine the pattern with other technical tools and market context to improve accuracy and avoid false signals.
Happy Trading!