
In the dynamic world of trading, chart patterns serve as valuable tools for predicting price movements. Among these, the rising wedge stands out as a powerful pattern that often signals a potential reversal or continuation in the market. Recognized by its converging, upward-sloping trendlines, the rising wedge helps traders identify shifts in momentum and make informed decisions. This article explores what a rising wedge is, how it functions, how to interpret it, and practical strategies for using it in trading.
What is a Rising Wedge?
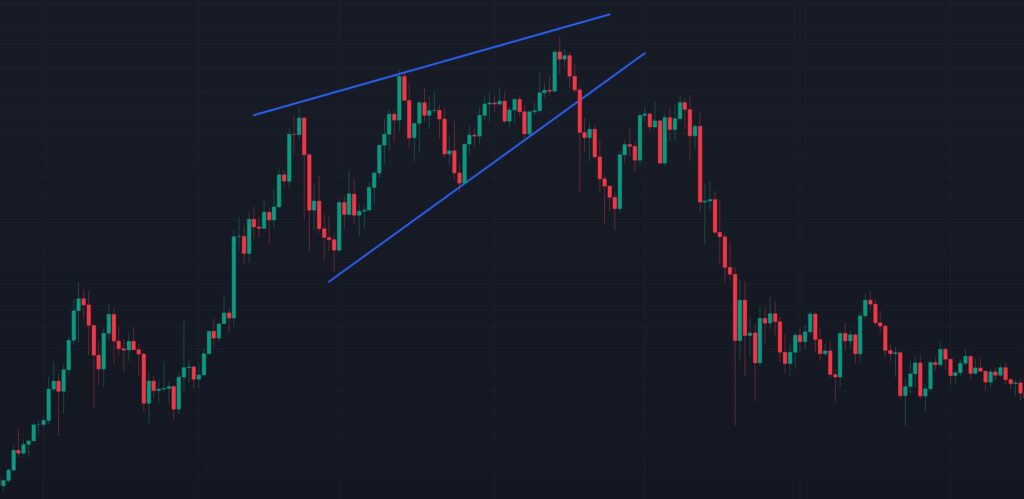
A rising wedge is a chart pattern in technical analysis characterized by converging trendlines that slope upward. It typically forms when the price of an asset makes higher highs and higher lows, but the range between these highs and lows narrows over time. This pattern is often considered a bearish reversal signal, though it can occasionally act as a continuation pattern depending on the context.
The rising wedge is identified by:
- Two upward-sloping trendlines: The upper trendline connects the higher highs, and the lower trendline connects the higher lows.
- Converging lines: The trendlines gradually come closer together, indicating decreasing price volatility and a potential breakout.
- Price action: The price oscillates between the two trendlines, forming a wedge shape.
How Does a Rising Wedge Work?
The rising wedge reflects a temporary bullish sentiment where buyers push prices higher, but the narrowing range suggests weakening momentum. As the wedge progresses:
- Buyers struggle to maintain higher highs, leading to smaller price increments.
- Sellers begin to dominate as buying pressure diminishes, increasing the likelihood of a downward breakout.
- The pattern typically resolves when the price breaks below the lower trendline, signaling a potential reversal from an uptrend to a downtrend.
In some cases, particularly in a strong downtrend, a rising wedge can act as a continuation pattern, where the price breaks upward, continuing the prior trend. However, the bearish breakout is more common.
How to Read a Rising Wedge?
To effectively read a rising wedge, traders should focus on the following elements:
- Identify the Trendlines:
- Draw the upper trendline by connecting at least two higher highs.
- Draw the lower trendline by connecting at least two higher lows.
- Ensure the trendlines are converging, forming a wedge shape.
- Confirm the Pattern:
- Look for at least three touches on each trendline to validate the pattern.
- Check for decreasing volume as the wedge forms, which often accompanies diminishing momentum.
- Assess the Context:
- Determine the preceding trend. A rising wedge after a prolonged uptrend typically signals a reversal, while one in a downtrend may indicate continuation.
- Analyze the timeframe. Rising wedges on longer timeframes (e.g., daily or weekly charts) tend to be more reliable.
- Monitor for Breakout:
- Watch for a decisive close below the lower trendline, often accompanied by increased volume, to confirm a bearish breakout.
- Be cautious of false breakouts, where the price briefly moves below the trendline but quickly reverses.
- Use Supporting Indicators:
- Relative Strength Index (RSI): A bearish divergence (price making higher highs while RSI makes lower highs) can confirm weakening momentum.
- Moving Averages: A price crossing below a key moving average (e.g., 50-day MA) after a breakout can reinforce the bearish signal.
- Volume: A spike in volume on the breakout increases the pattern’s reliability.
How to Use a Rising Wedge for Trading?
The rising wedge can be a powerful tool for traders when used correctly. Here’s a step-by-step guide to trading this pattern:
1. Entry Strategy
- Bearish Breakout (Reversal):
- Wait for a confirmed breakout below the lower trendline with a strong candlestick close (e.g., a large bearish candle).
- Enter a short position or sell the asset after the breakout is confirmed.
- For added confirmation, wait for a retest of the broken trendline (now acting as resistance) before entering.
- Bullish Breakout (Continuation):
- If the wedge forms in a downtrend, monitor for an upward breakout above the upper trendline.
- Enter a long position after the breakout, ideally with increased volume for confirmation.
2. Stop-Loss Placement
- Place a stop-loss above the upper trendline for a short position to protect against a false breakout.
- For a long position, place the stop-loss below the lower trendline.
- Adjust the stop-loss based on the asset’s volatility and your risk tolerance.
3. Target Setting
- Measure the Wedge Height: Calculate the vertical distance between the upper and lower trendlines at the widest part of the wedge (the base).
- Project the Target: From the breakout point, project the wedge height downward (for a bearish breakout) or upward (for a bullish breakout) to estimate the price target.
- Alternatively, use key support/resistance levels or Fibonacci retracement levels to identify potential targets.
4. Risk Management
- Use a risk-reward ratio of at least 1:2 (e.g., risk $1 to gain $2) to ensure the trade is worthwhile.
- Avoid overleveraging, as false breakouts can lead to losses.
- Monitor broader market conditions, as macroeconomic factors or news events can disrupt technical patterns.
Limitations of the Rising Wedge
- False Breakouts: The price may break out but quickly reverse, leading to losses if not managed properly.
- Subjectivity: Drawing trendlines can be subjective, and different traders may interpret the pattern differently.
- Market Noise: In volatile markets, the pattern may be less reliable due to erratic price movements.
- Context Dependency: The pattern’s success depends on the broader market trend and timeframe.
Conclusion
The rising wedge is a versatile chart pattern that provides traders with actionable insights into potential reversals or continuations. By understanding its structure, confirming breakouts, and applying sound risk management, traders can use the rising wedge to make informed decisions. However, like all technical patterns, it should be used in conjunction with other tools and market analysis to maximize its effectiveness.
Happy Trading!