
The double top is a popular chart pattern used in technical analysis to signal a potential reversal in a stock, forex, or other financial asset’s price trend. This article explains what a double top is, how it forms, how to interpret it, and how traders can use it to make informed trading decisions.
What is a Double Top?
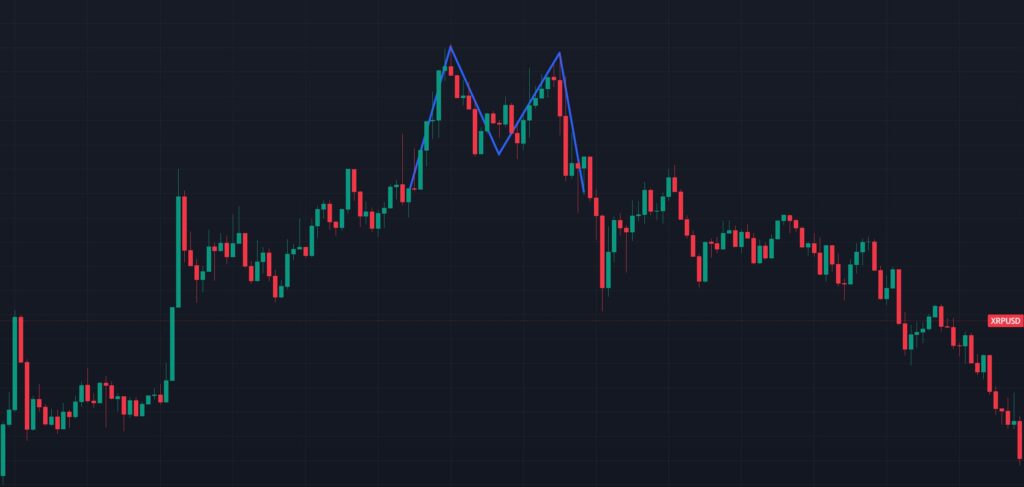
A double top is a bearish reversal pattern that typically appears after an uptrend in a price chart. It is characterized by two distinct peaks (or “tops”) at roughly the same price level, separated by a trough, forming a shape resembling the letter “M.” The pattern indicates that the price has twice attempted to break through a resistance level but failed, suggesting that bullish momentum is weakening and a downward move may follow.
Key Components of a Double Top
- Two Peaks: The price reaches a high point, retraces to a trough, and then rises again to a similar high before declining.
- Neckline: The horizontal line connecting the lowest points of the trough between the two peaks. This acts as a support level.
- Resistance Level: The price level at the peaks where the price struggles to break through.
- Breakout: The pattern is confirmed when the price breaks below the neckline after forming the second peak, signaling a potential downtrend.
How Does a Double Top Work?
The double top pattern reflects a shift in market sentiment. During an uptrend, buyers push the price higher until it hits a resistance level where selling pressure increases. After the first peak, the price pulls back to the neckline as buyers regroup. A second attempt to break the resistance forms the second peak, but if sellers overpower buyers again, the price falls. A break below the neckline confirms that sellers have taken control, often leading to a sustained downward move.
Formation Process
- Uptrend: The price rises steadily, indicating strong buying interest.
- First Peak: The price hits a resistance level and reverses, forming the first top.
- Trough: The price retraces to a support level (the neckline).
- Second Peak: The price rallies again but fails to break the resistance, forming the second top.
- Breakout: The price falls below the neckline, confirming the pattern and signaling a bearish reversal.
How to Read a Double Top?
To effectively read a double top pattern, traders should focus on the following elements:
- Identify the Uptrend: Confirm that the pattern forms after a sustained upward price movement. The longer and stronger the uptrend, the more significant the reversal may be.
- Locate the Peaks: Look for two peaks at approximately the same price level. The peaks don’t need to be identical but should be close.
- Draw the Neckline: Connect the lowest points of the trough between the peaks with a horizontal line. This serves as the key support level.
- Monitor Volume: Volume often spikes at the peaks and during the breakout. A higher volume on the break below the neckline strengthens the pattern’s reliability.
- Confirm the Breakout: The pattern is not complete until the price closes below the neckline. A false breakout may occur if the price briefly dips below the neckline but quickly recovers.
- Measure the Target: To estimate the potential price decline, measure the vertical distance from the peak to the neckline and project it downward from the breakout point.
How to Use a Double Top in Trading?
The double top pattern can be a powerful tool for traders, particularly in markets like stocks, forex, or cryptocurrencies. Here’s how to incorporate it into a trading strategy:
1. Entry Points
- Short Position: Enter a short (sell) position when the price breaks below the neckline with strong volume. This confirms the bearish reversal.
- Wait for Confirmation: To avoid false breakouts, some traders wait for a candlestick to close below the neckline or for a retest of the neckline from below before entering.
2. Stop-Loss Placement
- Place a stop-loss above the neckline or the second peak to protect against a failed pattern. For example, if the neckline is at $55, a stop-loss at $56 or $57 limits potential losses if the price reverses.
3. Profit Targets
- Calculate the profit target by subtracting the pattern’s height (peak to neckline distance) from the breakout point. For instance, if the height is $5 and the breakout occurs at $55, the target is $50.
- Alternatively, use support levels or other technical indicators (e.g., moving averages) to set targets.
4. Combine with Other Indicators
- Relative Strength Index (RSI): An overbought RSI (above 70) at the second peak can reinforce the bearish signal.
- Moving Averages: A bearish crossover (e.g., 50-day moving average crossing below the 200-day) can confirm the downtrend.
- Volume Analysis: A surge in selling volume during the breakout increases confidence in the pattern.
5. Risk Management
- Only risk a small percentage of your capital (e.g., 1-2%) per trade.
- Assess the risk-reward ratio. A good trade might offer at least a 2:1 reward-to-risk ratio (e.g., $4 potential profit vs. $2 potential loss).
Tips for Trading Double Tops
- Avoid Premature Entries: Wait for the neckline breakout to avoid getting caught in a false reversal.
- Context Matters: The pattern is more reliable on higher timeframes (e.g., daily or weekly charts) and in liquid markets.
- Watch for False Breakouts: If the price breaks the neckline but quickly reverses, it may indicate a trap. Use tight stop-losses to minimize losses.
- Practice Patience: Not every double top leads to a significant decline. Combine the pattern with other technical tools for better accuracy.
Limitations of the Double Top
- False Signals: The pattern can fail if the price breaks the neckline but reverses due to strong support or unexpected news.
- Subjectivity: Identifying the exact peaks and neckline can vary between traders, leading to inconsistent interpretations.
- Market Conditions: The pattern may be less reliable in choppy or low-volume markets.
Conclusion
The double top is a valuable tool for traders seeking to capitalize on bearish reversals. By understanding its formation, confirming breakouts, and combining it with other technical indicators, traders can make informed decisions to enter short positions or exit long ones. However, like all technical patterns, it’s not foolproof. Proper risk management and a disciplined approach are essential to successfully trading double tops.
Happy Trading!