
In the dynamic world of financial trading, chart patterns play a crucial role in predicting price movements and guiding trading decisions. One such pattern, the descending triangle, is a powerful tool for identifying potential bearish trends and occasional bullish reversals. This article explores what a descending triangle is, how it forms, how to interpret it, and how traders can use it effectively to navigate the markets with confidence.
What is a Descending Triangle?
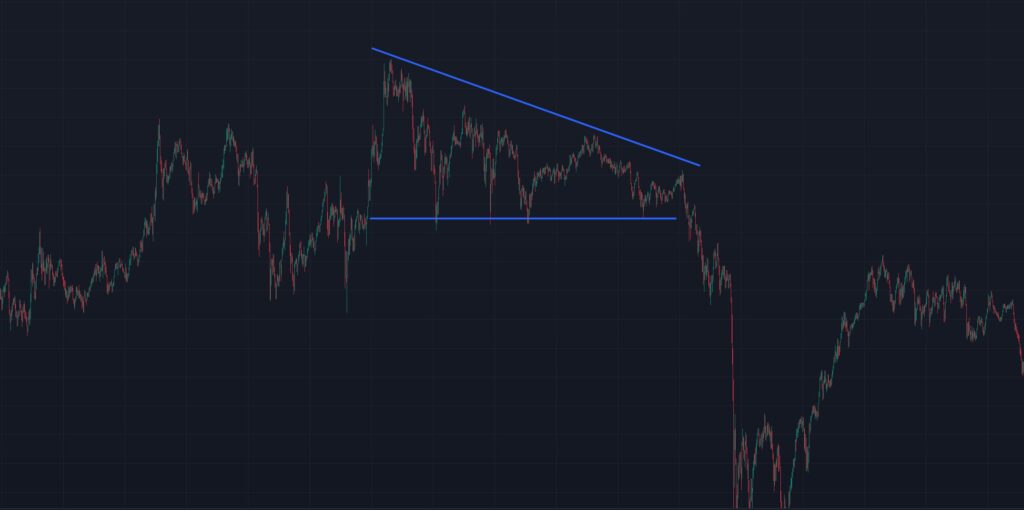
A descending triangle is a bearish chart pattern used in technical analysis to predict future price movements in financial markets, such as stocks, forex, or cryptocurrencies. It forms when the price of an asset creates a series of lower highs and a flat or horizontal support level. The pattern resembles a right-angled triangle with a downward-sloping upper trendline and a horizontal lower trendline.
This pattern typically indicates that selling pressure is increasing, as buyers are unable to push the price above the declining resistance level, while sellers consistently defend the support level. The descending triangle often signals a potential breakout to the downside, making it a valuable tool for traders.
How Does a Descending Triangle Work?
The descending triangle forms during a downtrend or a period of consolidation, reflecting a battle between buyers and sellers. Here’s how it develops:
- Lower Highs: The price fails to reach previous highs, forming a downward-sloping trendline (resistance). This indicates weakening buying momentum as sellers step in at lower price levels.
- Horizontal Support: The price repeatedly tests a specific support level without breaking below it, forming a flat lower trendline. This shows that buyers are defending this level, but their strength is diminishing.
- Converging Trendlines: As the price continues to make lower highs and test the support, the two trendlines converge, creating a triangle shape. This tightening range suggests a buildup of pressure, often leading to a breakout.
- Breakout: The pattern typically resolves with a breakout below the support level, as selling pressure overwhelms buyers, leading to a continuation of the downtrend.
However, in some cases, the price may break above the upper trendline, signaling a bullish reversal, though this is less common.
How to Read a Descending Triangle?
To effectively read a descending triangle, traders should focus on the following elements:
- Identify the Pattern: Look for a series of lower highs forming a downward-sloping trendline and a horizontal support level. Use charting tools to draw these trendlines and confirm the triangle shape.
- Volume Analysis: Volume often decreases as the pattern forms, indicating declining participation and a tightening range. A spike in volume on the breakout (especially downward) confirms the pattern’s validity.
- Timeframe: The pattern can appear on any timeframe, from intraday charts (e.g., 5-minute) to longer-term charts (e.g., daily or weekly). Longer timeframes generally produce more reliable signals.
- Breakout Confirmation: A breakout is confirmed when the price closes below the support level (for a bearish move) or above the resistance trendline (for a bullish move) with strong volume. False breakouts can occur, so wait for a candle close to confirm.
- Measure the Price Target: To estimate the potential price move after a breakout, measure the height of the triangle at its widest point (the vertical distance between the upper trendline and the support level). Subtract this distance from the breakout point for a bearish target or add it for a bullish target.
How to Use a Descending Triangle for Trading?
The descending triangle can be a powerful tool for traders when used correctly. Here are steps and strategies to trade this pattern:
1. Entry Points
- Bearish Breakout: Enter a short position (or sell) when the price breaks below the support level with a strong candle close and increased volume. This confirms that sellers have taken control.
- Bullish Breakout (Rare): If the price breaks above the upper trendline with high volume, consider entering a long position (or buy), as this indicates a potential trend reversal.
- Wait for Confirmation: To avoid false breakouts, wait for a candle to close below/above the breakout level or use additional indicators like moving averages or the Relative Strength Index (RSI) to confirm the move.
2. Stop-Loss Placement
- For a bearish breakout, place a stop-loss above the most recent lower high or the upper trendline to protect against a false breakout.
- For a bullish breakout, place a stop-loss below the support level to limit losses if the price reverses.
3. Profit Targets
- Use the triangle’s height to set a profit target. For a bearish breakout, subtract the height from the breakout point. For a bullish breakout, add the height to the breakout point.
- Alternatively, trail the stop-loss using a moving average or key support/resistance levels to capture larger trends.
4. Risk Management
- Only risk a small percentage of your trading capital (e.g., 1-2%) per trade to manage potential losses.
- Ensure the risk-to-reward ratio is favorable (e.g., at least 1:2) before entering a trade.
5. Combine with Other Indicators
- Use indicators like RSI, MACD, or Bollinger Bands to confirm the breakout direction and avoid false signals.
- Check for fundamental factors (e.g., earnings reports, economic data) that could influence the asset’s price and affect the pattern’s reliability.
Limitations of the Descending Triangle
While the descending triangle is a reliable pattern, it has limitations:
- False Breakouts: Prices may briefly break the support or resistance only to reverse, leading to losses if traders act prematurely.
- Market Conditions: The pattern’s reliability decreases in choppy or low-volume markets.
- Subjectivity: Drawing trendlines can be subjective, and different traders may interpret the pattern differently.
- Context Matters: The pattern’s success depends on the broader market trend and fundamental factors. Always consider the bigger picture.
Conclusion
The descending triangle is a versatile and widely used chart pattern that helps traders identify potential bearish breakouts and, in rare cases, bullish reversals. By understanding how to read the pattern, confirming breakouts with volume and indicators, and applying sound risk management, traders can use the descending triangle to make informed trading decisions. However, like all technical patterns, it should be used in conjunction with other tools and market analysis to maximize its effectiveness.
Happy Trading!