
In the fast-paced world of financial trading, recognizing chart patterns can provide a significant edge. One such pattern, the bearish pennant, is a key tool for traders aiming to profit from continued downward price movements. This article explores what a bearish pennant is, how it forms, how to interpret it, and practical strategies for using it in trading.
What is a Bearish Pennant?
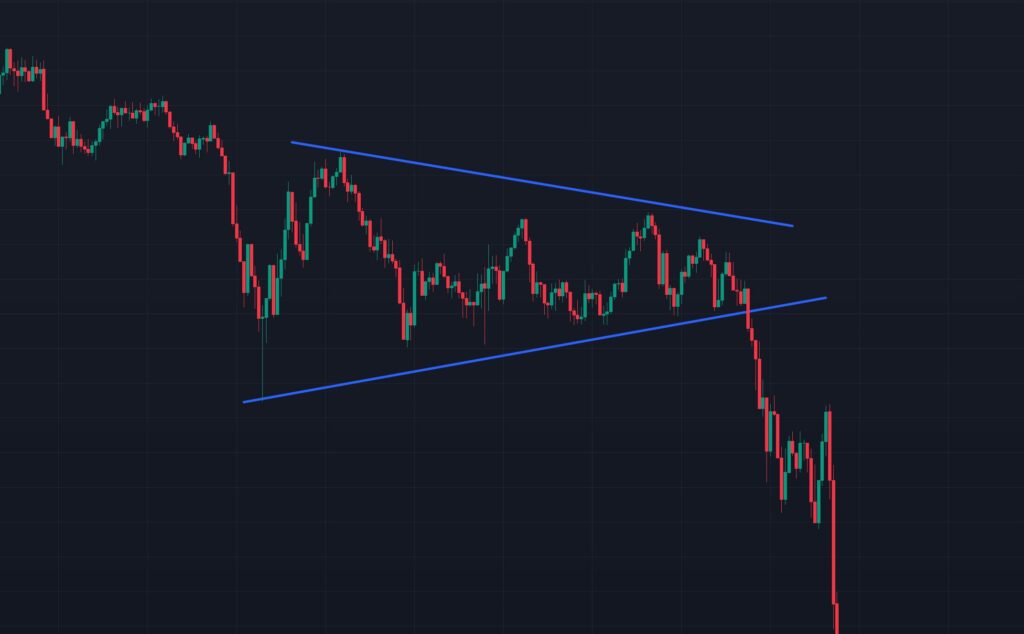
A bearish pennant is a technical chart pattern that signals a continuation of a downward price trend in financial markets, such as stocks, forex, or cryptocurrencies. It forms after a sharp decline in price (known as the “flagpole”) followed by a period of consolidation, where the price moves sideways or slightly upward in a converging, triangular shape (the “pennant”). This pattern suggests that sellers are pausing before resuming the downward momentum. It reflects a temporary balance between buyers and sellers before the sellers regain control.
How Does a Bearish Pennant Work?
The bearish pennant forms in three key phases:
- Flagpole: A steep, high-volume drop in price, indicating strong selling pressure.
- Pennant Formation: After the sharp decline, the price consolidates, forming a small symmetrical triangle. This is characterized by lower highs and higher lows as trading volume decreases, showing indecision or a pause in the market.
- Breakout: The price breaks below the lower trendline of the pennant, resuming the downtrend. This breakout is often accompanied by an increase in trading volume, confirming the continuation of the bearish trend.
The pattern works because it captures the market’s psychology: the consolidation phase represents buyers attempting to push back, but their lack of strength allows sellers to dominate once the breakout occurs.
How to Read a Bearish Pennant?
To identify and read a bearish pennant on a price chart, follow these steps:
- Spot the Flagpole: Look for a sharp, near-vertical price drop with high trading volume. This sets the stage for the pattern.
- Identify the Pennant: After the drop, the price should form a small, triangular shape with converging trendlines. Connect the lower highs with a downward-sloping resistance line and the higher lows with an upward-sloping support line. The pennant usually forms over 1–4 weeks.
- Monitor Volume: Volume typically decreases during the pennant formation, indicating reduced market activity. A spike in volume on the breakout below the support line confirms the pattern.
- Confirm the Breakout: The pattern is validated when the price closes below the lower trendline of the pennant. A false breakout may occur if the price quickly reverses back into the pennant, so wait for confirmation (e.g., a strong bearish candle or increased volume).
How to Use a Bearish Pennant for Trading?
Traders can use the bearish pennant to plan entries, exits, and risk management. Here’s a step-by-step guide:
1. Entry Point
- Wait for the Breakout: Enter a short position (or sell) when the price breaks below the pennant’s lower trendline with strong volume. This confirms the continuation of the downtrend.
- Optional Early Entry: Aggressive traders may enter during the pennant formation if the price nears the upper resistance line, anticipating a rejection. However, this carries higher risk.
2. Setting a Price Target
- Measure the length of the flagpole (the initial sharp decline) in terms of price.
- Project this distance downward from the breakout point to estimate the target price. For example, if the flagpole was a $10 drop, expect a similar $10 drop after the breakout.
3. Stop-Loss Placement
- Place a stop-loss order above the upper trendline of the pennant to protect against false breakouts or trend reversals.
- Alternatively, set the stop-loss just above the most recent high within the pennant for tighter risk management.
4. Risk Management
- Use a risk-reward ratio of at least 1:2 (e.g., risk $1 to gain $2). Ensure the potential profit (based on the flagpole projection) justifies the risk.
- Monitor volume during the breakout. Low volume may indicate a weak signal, prompting caution.
5. Exit Strategy
- Exit the trade when the price reaches the projected target or shows signs of reversal (e.g., a bullish candlestick pattern or increasing volume on an upward move).
- Consider trailing stops to lock in profits if the downtrend extends beyond the target.
Key Considerations
- Market Context: The bearish pennant is most reliable in a clear downtrend. In a bullish or choppy market, false signals are more likely.
- Confirmation Tools: Use indicators like the Relative Strength Index (RSI) or Moving Averages to confirm the downtrend’s strength. For example, an RSI below 50 supports bearish momentum.
- False Breakouts: Always wait for a confirmed breakout (e.g., a candle close below the trendline) to avoid premature trades.
- Timeframe: The pattern can appear on any timeframe, but longer timeframes (e.g., daily charts) tend to produce stronger signals.
Conclusion
The bearish pennant is a powerful tool for traders looking to capitalize on continued downtrends. By understanding its structure—flagpole, pennant, and breakout—and applying disciplined entry, exit, and risk management strategies, traders can improve their odds of success. Always combine the pattern with other technical indicators and market analysis to enhance reliability, and practice on historical charts or demo accounts to build confidence before trading with real capital.
Happy Trading!