
The bearish flag is a powerful technical chart pattern used by traders to identify potential continuations of a downtrend in financial markets. This article explains what a bearish flag is, how it works, how to read it, and how traders can use it to make informed trading decisions.
What is a Bearish Flag?
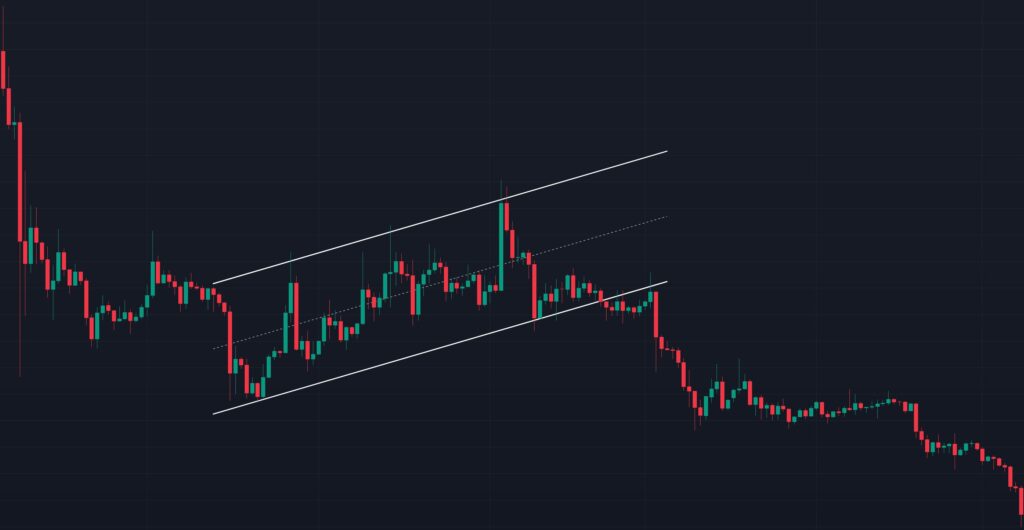
A bearish flag is a continuation pattern that appears during a downtrend, signaling a brief pause or consolidation before the price resumes its downward movement. It is characterized by two main components:
- Flagpole: A sharp, steep decline in price, representing strong selling pressure.
- Flag: A short-term consolidation phase where the price moves sideways or slightly upward within a parallel channel, forming a rectangular “flag” shape.
The pattern resembles a flag on a pole, hence the name. It typically indicates that sellers are taking a breather before pushing the price lower.
How Does a Bearish Flag Work?
The bearish flag forms when a strong downward price movement (the flagpole) is followed by a period of consolidation (the flag). This consolidation occurs as buyers attempt to push the price higher, but the selling pressure remains dominant. The flag is usually tilted upward or moves sideways, reflecting weaker buying interest. Once the consolidation phase ends, the price typically breaks below the lower boundary of the flag, resuming the downtrend.
The bearish flag works because it reflects market psychology:
- The initial sharp decline (flagpole) shows strong bearish momentum.
- The consolidation (flag) indicates a temporary balance between buyers and sellers.
- The breakout below the flag confirms that sellers have regained control, leading to further price declines.
How to Read a Bearish Flag?
To identify and read a bearish flag on a price chart, follow these steps:
- Identify the Flagpole: Look for a sharp, near-vertical drop in price over a short period. This indicates strong selling pressure and sets the stage for the pattern.
- Spot the Flag: After the flagpole, the price should consolidate, forming a rectangular channel with two parallel trendlines. The upper trendline (resistance) connects the highs, and the lower trendline (support) connects the lows. The flag may slope slightly upward or remain flat.
- Confirm the Downtrend: Ensure the pattern occurs within a broader downtrend. A bearish flag is less reliable in a bullish or sideways market.
- Watch for Volume: Volume often spikes during the flagpole, decreases during the flag formation, and increases again on the breakout below the lower trendline.
- Monitor the Breakout: The pattern is confirmed when the price breaks below the lower trendline of the flag with strong momentum, signaling the continuation of the downtrend.
How to Use a Bearish Flag for Trading?
Traders can use the bearish flag to plan entries, set stop-losses, and estimate price targets. Here’s a step-by-step guide:
- Entry Point:
- Enter a short (sell) position when the price breaks below the lower trendline of the flag with strong volume. This breakout confirms the resumption of the downtrend.
- Alternatively, aggressive traders may enter near the upper trendline of the flag, anticipating a rejection, but this carries higher risk.
- Stop-Loss Placement:
- Place a stop-loss above the upper trendline of the flag to protect against a false breakout or trend reversal.
- Alternatively, set the stop-loss above the highest point of the flag for added safety.
- Price Target:
- Measure the length of the flagpole (the initial sharp decline) in terms of price.
- Project this distance downward from the breakout point to estimate the potential price target. For example, if the flagpole represents a $10 drop, expect a similar $10 decline after the breakout.
- Risk Management:
- Use a risk-reward ratio (e.g., 1:2 or 1:3) to ensure the potential reward justifies the risk.
- Avoid trading bearish flags in low-volume markets or during major news events, as these can lead to false signals.
- Confirmation Tools:
- Use additional indicators, such as the Relative Strength Index (RSI) or Moving Averages, to confirm bearish momentum.
- Monitor volume to ensure it increases on the breakout, validating the pattern.
Advantages and Risks
Advantages:
- Easy to identify on charts.
- Provides clear entry, stop-loss, and target levels.
- Reliable in strong downtrends with high volume.
Risks:
- False breakouts can occur, especially in choppy markets.
- Requires confirmation to avoid mistaking it for other patterns (e.g., a rectangle or triangle).
- May fail in the presence of unexpected news or market reversals.
Conclusion
The bearish flag is a valuable tool for traders looking to capitalize on downtrends. By understanding its structure—flagpole and flag—and learning to read its signals, traders can identify high-probability setups for shorting. To use it effectively, confirm the pattern with volume and other indicators, apply sound risk management, and trade within the context of a broader downtrend.
Happy Trading!