

The Elliott Wave Triangle is a corrective pattern in Elliott Wave Theory, often appearing in financial markets to indicate a period of consolidation before the trend resumes. Identified by Ralph Nelson Elliott, this pattern reflects a balance between buyers and sellers, typically forming before a final move in the prevailing trend. This article explains the structure, rules, and guidelines of the Elliott Wave Triangle.
Structure of the Triangle
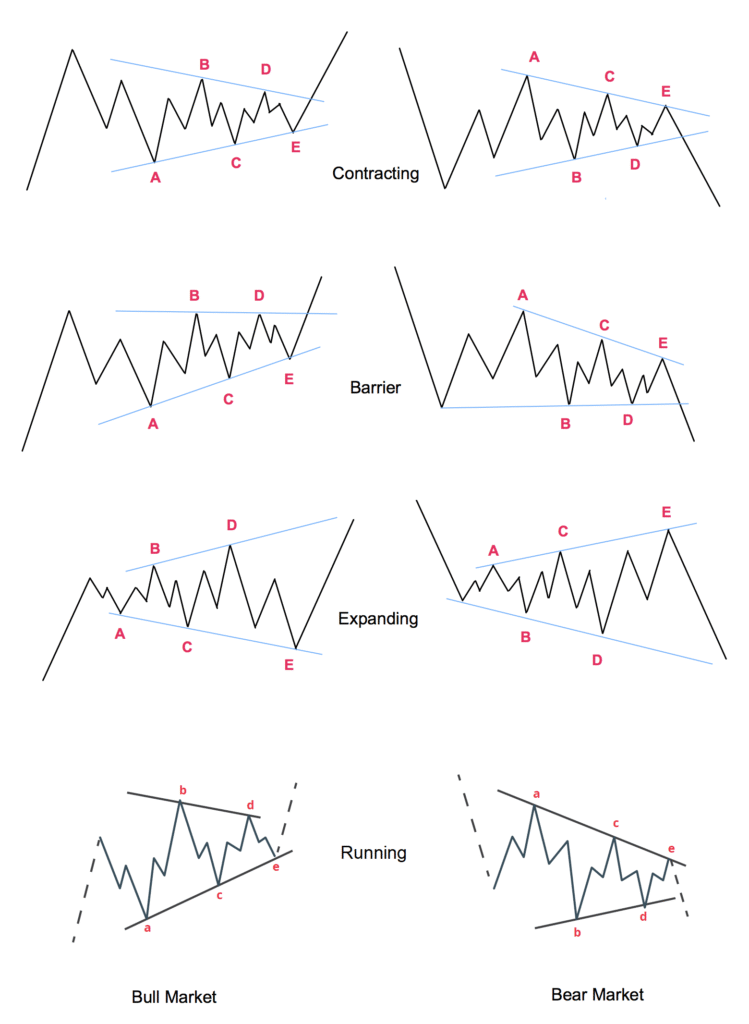
A triangle is a corrective pattern consisting of five waves, labeled A-B-C-D-E, which move sideways within converging trendlines, forming a triangular shape. Each wave subdivides into a three-wave structure (a-b-c), distinguishing triangles from impulsive waves. Triangles can appear in:
- Wave 4 of an impulse wave (preceding the final wave 5).
- Wave B of an A-B-C correction.
- Part of a complex correction, such as a combination pattern.
There are four main types of triangles: contracting, running, expanding and barrier. The most common is the contracting triangle, where the range between waves narrows over time.
Rules of the Elliott Wave Triangle
To correctly identify and label a triangle, the following strict rules must be adhered to:
- Five-Wave Structure: The pattern must consist of five waves (A-B-C-D-E), at least four of five subdividing into a corrective three-wave structure (a-b-c).
- Converging Trendlines: Waves must form within two trendlines that converge (for contracting triangles) or diverge (for expanding triangles). In barrier triangles, one trendline may be horizontal.
- Wave Overlap: The waves must overlap in price, meaning the high of one wave (e.g., B) may not exceed the low of another (e.g., D), creating a confined range.
- Time and Price Constraints: Each wave should be smaller in price and/or time than the preceding wave in a contracting triangle (e.g., Wave C is smaller than Wave A, Wave E is smaller than Wave C).
- Position: Triangles typically appear in corrective positions (Wave 4, Wave B, or within complex corrections) and never as motive waves (Wave 1, 3, or 5).
Guidelines for Analyzing Triangles
While rules are mandatory, guidelines provide additional context for identifying triangles but are not always strictly followed:
- Symmetry: In a contracting triangle, waves often form a roughly symmetrical shape, with each wave approximately 61.8% of the previous wave’s length (Fibonacci ratio).
- Thrust: After the triangle completes (Wave E), a breakout or “thrust” typically occurs in the direction of the prior trend. The thrust often equals the width of the triangle’s widest part (e.g., Wave A’s range).
- Volume: Trading volume often decreases as the triangle progresses, reflecting reduced market conviction, and increases during the breakout.
- Wave E Behavior: Wave E is often the shortest wave and may undershoot the trendline. In some cases can unfold as a triangle itself.
Conclusion
The Elliott Wave Triangle is a powerful tool for understanding market consolidation and predicting breakouts. By adhering to its strict rules—five corrective waves, converging trendlines, and proper positioning—and considering guidelines like symmetry and thrust, traders can enhance their market analysis. While triangles require practice to identify accurately, their predictive power makes them invaluable in technical analysis.
Happy Trading!