

The Keltner Channel is a popular technical analysis tool used by traders to identify trends, measure volatility, and spot potential trading opportunities in financial markets. Developed by Chester W. Keltner in the 1960s and later refined, this indicator combines elements of moving averages and volatility to create a dynamic channel around a price chart. In this article, we’ll explore what the Keltner Channel is, how it works, how to interpret it, and how traders can use it effectively in their strategies.
What is the Keltner Channel?
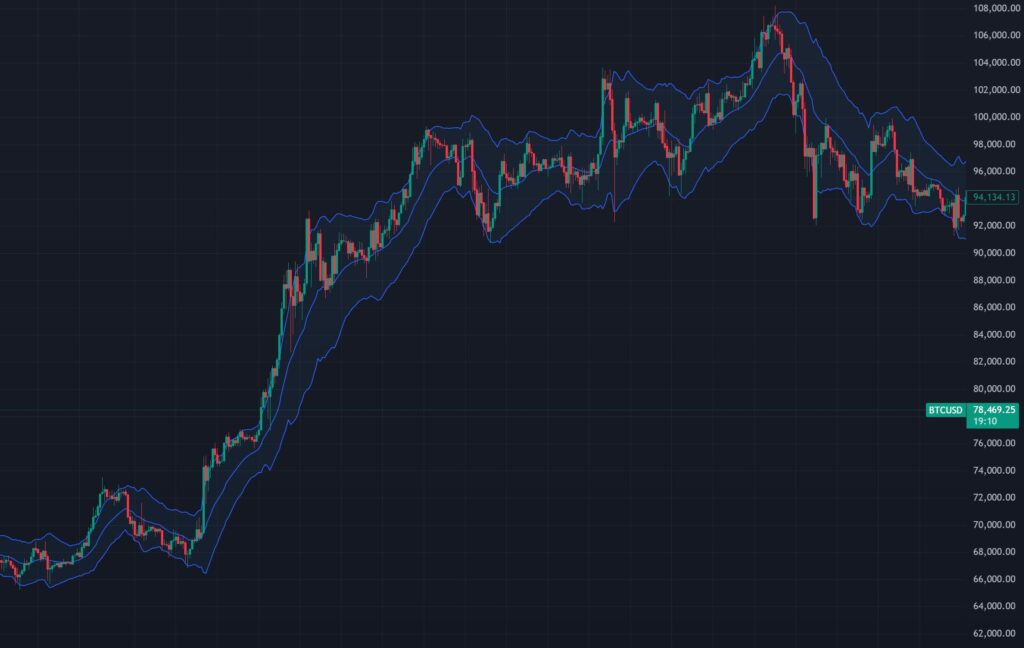
The Keltner Channel is a volatility-based indicator that consists of three lines plotted on a price chart:
- Middle Line: An Exponential Moving Average (EMA), typically set to a 20-period EMA, representing the central trend of the price.
- Upper Band: Calculated by adding a multiple of the Average True Range (ATR) to the EMA.
- Lower Band: Calculated by subtracting a multiple of the ATR from the EMA.
The ATR measures market volatility by considering the range of price movements over a specified period (commonly 10 or 14 periods). The Keltner Channel expands and contracts based on this volatility, making it a dynamic tool that adapts to changing market conditions.
Unlike similar tools like Bollinger Bands, which use standard deviation for their bands, the Keltner Channel relies on ATR, giving it a smoother and less erratic appearance. This makes it particularly useful for trend-following and breakout strategies.
How Does the Keltner Channel Work?
The Keltner Channel is calculated using the following formula:
- Middle Line: EMA = Exponential Moving Average of the closing price (e.g., 20-period EMA).
- Upper Band: EMA + (Multiplier × ATR).
- Lower Band: EMA – (Multiplier × ATR).
The “multiplier” is a user-defined value, typically set between 1 and 3, with 2 being the most common default. A higher multiplier widens the channel, while a lower multiplier narrows it.
For example:
- If the 20-period EMA is $100, the ATR is $2, and the multiplier is 2:
- Upper Band = $100 + (2 × $2) = $104.
- Lower Band = $100 – (2 × $2) = $96.
As price and volatility change, the channel adjusts dynamically. When volatility increases (larger ATR), the bands widen; when volatility decreases, the bands contract.
How to Read the Keltner Channel?
Interpreting the Keltner Channel involves analyzing the price’s position relative to the bands and the channel’s width. Here’s a breakdown of what to look for:
- Price Near the Middle Line (EMA):
- When the price hovers around the EMA, it suggests a lack of strong trend or consolidation. Traders may wait for a breakout or reversal signal.
- Price Approaching or Breaking the Upper Band:
- If the price touches or exceeds the upper band, it indicates strong upward momentum or a potential overbought condition. A breakout above the band could signal the start of a bullish trend.
- Price Approaching or Breaking the Lower Band:
- If the price touches or falls below the lower band, it suggests strong downward momentum or a potential oversold condition. A breakout below the band could signal a bearish trend.
- Channel Width:
- Narrow Channel: Low volatility, often preceding a breakout. Prices tend to consolidate within a tight range.
- Wide Channel: High volatility, indicating strong trending behavior or significant price movement.
- Trend Direction:
- If the channel slopes upward and the price stays near or above the EMA, it’s a bullish trend.
- If the channel slopes downward and the price stays near or below the EMA, it’s a bearish trend.
How to Use the Keltner Channel for Trading?
The Keltner Channel can be applied in various trading strategies, including trend-following, breakout trading, and mean reversion. Here are some practical ways to use it:
- Trend Following:
- Buy Signal: Enter a long position when the price breaks above the upper band and the channel slopes upward, confirming bullish momentum.
- Sell Signal: Enter a short position when the price breaks below the lower band and the channel slopes downward, confirming bearish momentum.
- Tip: Combine with other indicators (e.g., RSI or MACD) to confirm the trend’s strength.
- Breakout Trading:
- During periods of low volatility (narrow channel), watch for a breakout above the upper band or below the lower band. This often signals the start of a significant price move.
- Example: If a stock consolidates for weeks and then breaks above the upper band with high volume, it could indicate a strong upward move.
- Mean Reversion:
- When the price extends far beyond the upper or lower band, it may indicate an overbought or oversold condition. Traders can anticipate a reversal back toward the EMA.
- Example: If a stock surges above the upper band and shows signs of exhaustion (e.g., declining volume), consider a short trade expecting a pullback.
- Stop-Loss and Take-Profit Placement:
- Use the bands as dynamic levels for risk management. For a long trade, place a stop-loss below the lower band; for a short trade, place it above the upper band.
- Take-profit targets can be set at key support/resistance levels or when the price returns to the EMA.
Advantages and Limitations
Advantages:
- Adapts to volatility, making it versatile across different market conditions.
- Simple to interpret for identifying trends and breakouts.
- Works well in trending markets when paired with other indicators.
Limitations:
- Can produce false signals in choppy or sideways markets.
- Lagging nature of the EMA may delay entry/exit signals.
- Requires customization (e.g., adjusting the multiplier or period) to suit specific assets or timeframes.
Conclusion
The Keltner Channel is a powerful and flexible tool for traders looking to navigate the complexities of financial markets. By combining a moving average with volatility-based bands, it provides clear visual cues about price trends, momentum, and potential reversals. Whether you’re a trend follower, breakout trader, or mean-reversion enthusiast, the Keltner Channel can enhance your analysis when used thoughtfully. As with any indicator, it’s best to test it on your preferred markets and timeframes, and consider pairing it with other tools to refine your trading decisions.
Happy trading!