

The Supertrend indicator is a popular technical analysis tool used by traders to identify market trends and potential entry or exit points in trading. It is particularly favored in volatile markets like stocks, forex, and cryptocurrencies due to its simplicity and effectiveness in signaling trend direction. This article will explain what the Supertrend indicator is, how it works, how to read it, and how traders can use it to enhance their strategies.
What is the Supertrend Indicator?
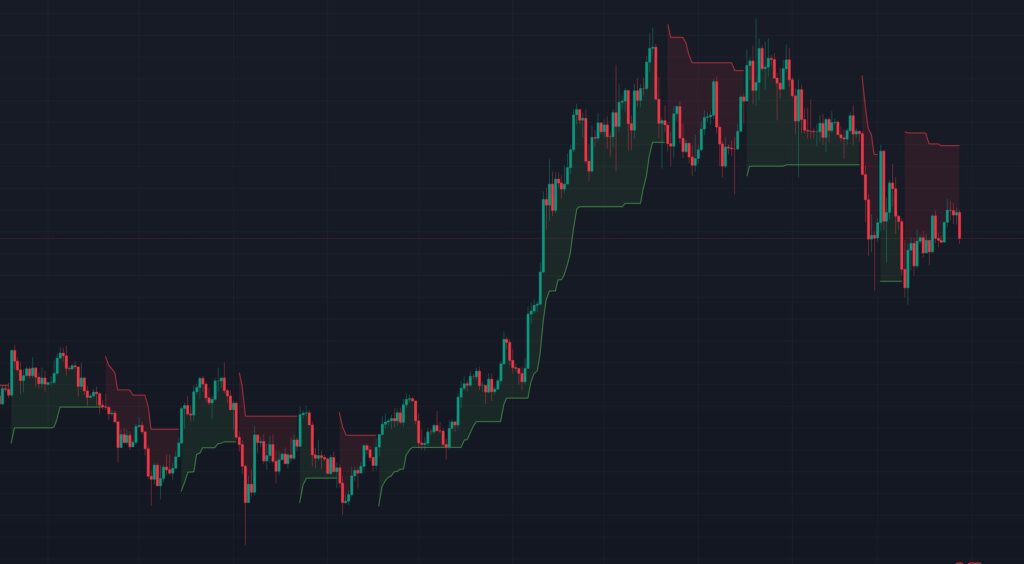
The Supertrend indicator is a trend-following overlay that plots a line on a price chart, helping traders determine whether the market is in an uptrend or downtrend. It was developed to provide clear buy and sell signals based on price action and volatility. Unlike some other indicators that oscillate between fixed values, the Supertrend dynamically adjusts to price movements, making it adaptable to changing market conditions.
The indicator combines two key components: the Average True Range (ATR) and a multiplier. The ATR measures market volatility, while the multiplier fine-tunes the sensitivity of the indicator. Together, these elements create a line that either sits above or below the price, indicating the direction of the trend.
How Does the Supertrend Indicator Work?
The Supertrend indicator is calculated using the following steps:
- Calculate the ATR: The Average True Range is typically calculated over a specific period (e.g., 14 days or bars). It measures the average range between the high and low prices, factoring in gaps from the previous close, to gauge volatility.
- Determine the Basic Upper and Lower Bands:
- Upper Band = (High + Low) / 2 + (Multiplier × ATR)
- Lower Band = (High + Low) / 2 – (Multiplier × ATR) Here, the multiplier is a user-defined value (commonly set to 3, though it can be adjusted).
- Plot the Supertrend Line:
- If the price closes above the Upper Band, the Supertrend line switches to the Lower Band and turns green (indicating an uptrend).
- If the price closes below the Lower Band, the Supertrend line switches to the Upper Band and turns red (indicating a downtrend).
- The line continues to adjust dynamically as the price moves, staying below the price in an uptrend and above it in a downtrend.
The default settings for the Supertrend are often a 14-period ATR and a multiplier of 3, but traders can tweak these parameters based on their trading style or the asset’s volatility.
How to Read the Supertrend Indicator?
Reading the Supertrend indicator is straightforward, as it provides clear visual cues:
- Green Line Below Price: This signals an uptrend. The market is bullish, and the price is expected to rise. The green line acts as a dynamic support level.
- Red Line Above Price: This indicates a downtrend. The market is bearish, and the price is expected to fall. The red line serves as a dynamic resistance level.
- Trend Reversal: When the Supertrend line flips from green to red (or vice versa), it suggests a potential reversal in the trend. For example, if the line shifts from below the price to above it, the uptrend may be ending, signaling a sell opportunity.
The distance between the Supertrend line and the price also reflects volatility. A wider gap indicates stronger momentum, while a narrowing gap may suggest weakening momentum or an impending reversal.
How to Use the Supertrend Indicator in Trading?
The Supertrend indicator is versatile and can be applied in various trading strategies. Here’s how traders commonly use it:
- Trend Identification:
- Use the Supertrend to confirm the direction of the market. In a green (bullish) phase, focus on long positions; in a red (bearish) phase, consider short positions or exiting longs.
- Entry and Exit Signals:
- Buy Signal: When the Supertrend line turns green and moves below the price, it’s a potential buy signal. This suggests the start of an uptrend.
- Sell Signal: When the Supertrend line turns red and moves above the price, it’s a potential sell signal, indicating a downtrend.
- Traders often wait for confirmation (e.g., a candlestick close) to avoid false signals.
- Stop-Loss Placement:
- The Supertrend line can act as a trailing stop-loss. In an uptrend, place the stop-loss below the green line; in a downtrend, place it above the red line. As the line adjusts with price movement, it helps lock in profits while limiting losses.
- Combining with Other Indicators:
- To filter out false signals, pair the Supertrend with tools like moving averages, RSI, or MACD. For example, use a 50-day moving average to confirm the trend direction before acting on a Supertrend signal.
- Timeframe Flexibility:
- The Supertrend works across different timeframes, from intraday (e.g., 5-minute charts) to long-term (e.g., daily or weekly charts). Short-term traders may prefer a lower ATR period (e.g., 7) and multiplier (e.g., 2) for faster signals, while long-term traders might stick with default settings.
Advantages and Limitations
Advantages:
- Simple and easy to interpret, even for beginners.
- Adapts to volatility, reducing lag compared to some moving averages.
- Provides clear buy/sell signals and stop-loss levels.
Limitations:
- Can generate false signals in sideways or choppy markets.
- Lags slightly behind price action, as it’s based on historical data.
- Requires optimization of settings for different assets or market conditions.
Conclusion
The Supertrend indicator is a powerful tool for traders seeking to ride trends and manage risk effectively. Its ability to adapt to price and volatility makes it a favorite among technical analysts. However, like any indicator, it’s not foolproof and works best when combined with other tools and a solid understanding of market context.
Happy Trading!